
Most american millennial tech professionals agree that data is the difference between wishful thinking and real business results. Launching a side business with limited entrepreneurial experience can feel like a risk, but choosing a data-driven approach dramatically increases the odds of success. By mastering analytics and using key market signals, you turn uncertainty into strategic action that puts profit within reach. This guide reveals practical steps and expert tips for converting raw information into reliable growth strategies.
Table of Contents
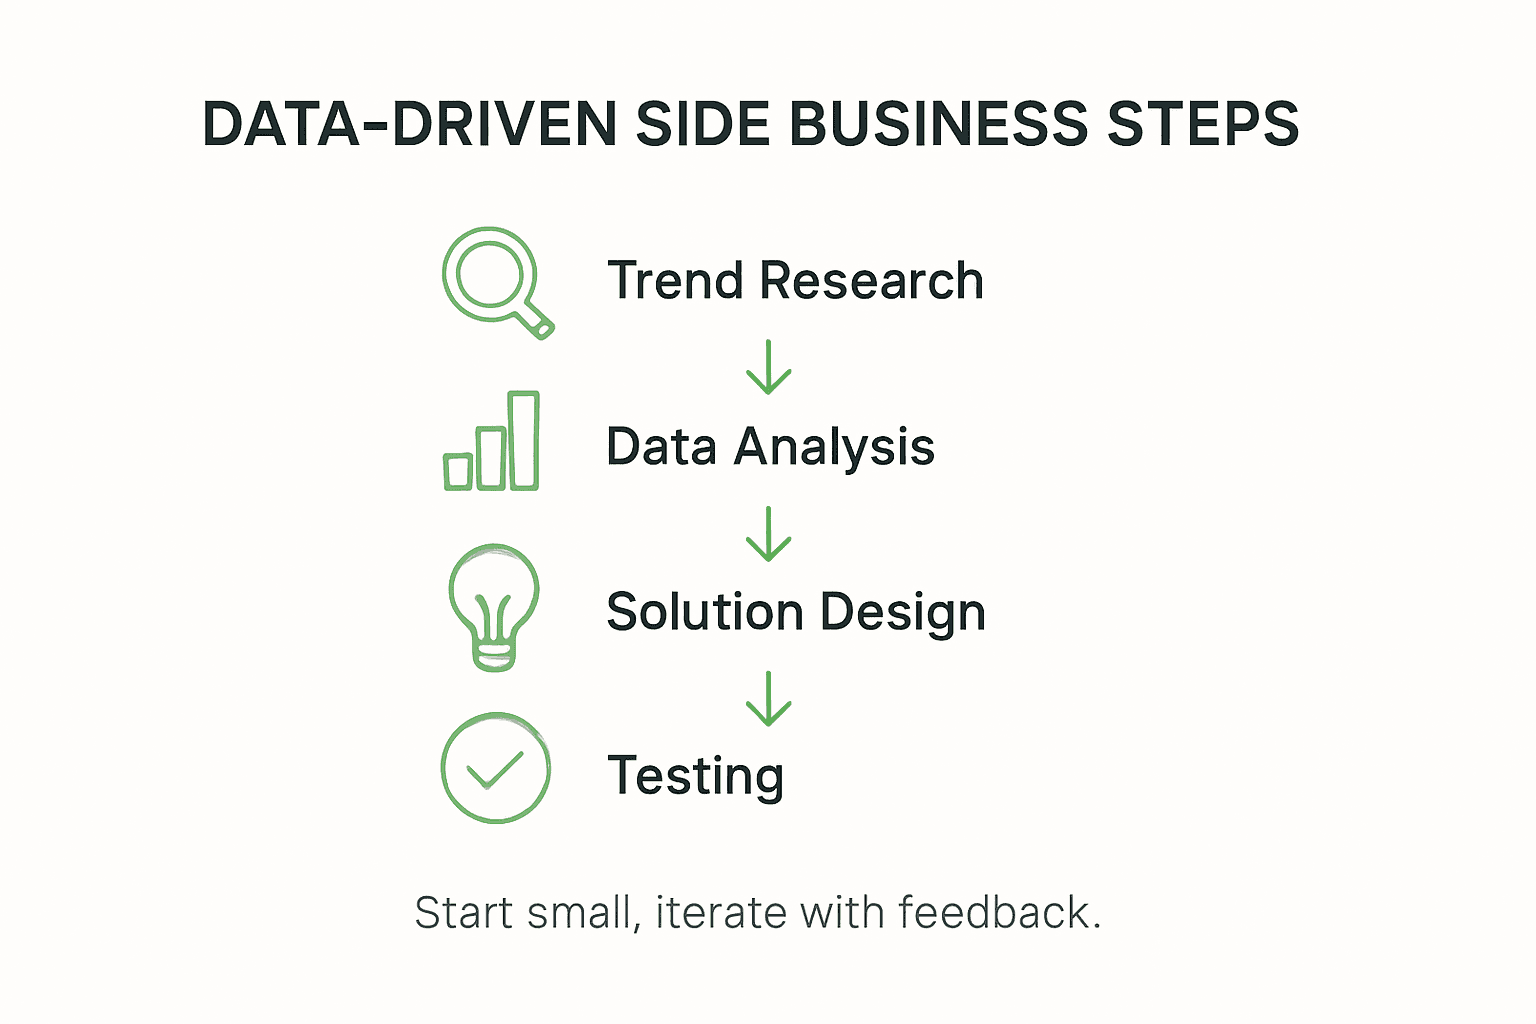
- Step 1: Assess Current Market Trends Using Data
- Step 2: Uncover Actionable Insights From Analytics
- Step 3: Design Business Solutions Informed By Data
- Step 4: Test And Refine Your Business Approach
- Step 5: Validate Results And Optimize For Growth
Quick Summary
| Key Point | Explanation |
|---|---|
| 1. Utilize global trend data | Leverage resources from platforms like Ipsos to gain insights into consumer behavior across various markets. |
| 2. Implement analytics methodologies | Use descriptive, diagnostic, predictive, and prescriptive analytics to inform decisions and identify business opportunities. |
| 3. Create data-driven solutions | Combine quantitative and qualitative data to design solutions that address real market needs effectively. |
| 4. Conduct iterative testing | Test business concepts through small experiments and adjust based on feedback to ensure market readiness. |
| 5. Regularly validate performance metrics | Monitor key performance indicators to optimize business strategies and identify growth opportunities continuously. |
Step 1: Assess current market trends using data
Understanding market trends starts with strategic data collection and analysis. Think of it like decoding a complex puzzle where each data point reveals another part of the business landscape. Your goal? Transform raw information into actionable market intelligence that guides your side business strategy.
To effectively assess market trends, begin by leveraging comprehensive research platforms that compile global insights. Global trend research from Ipsos offers an excellent starting point, providing data from interviews across 50 markets representing 87% of the global economy. This approach allows you to understand broader consumer behaviors and emerging patterns. Look for consistent signals across different sectors tech, finance, health that might indicate scalable opportunities for your side business.
Analyzing market trends requires a systematic approach. Start by identifying 3-5 reputable data sources like industry reports, academic research databases, and consumer insight platforms. Cross reference these sources to validate emerging trends. Pay special attention to market intelligence research that highlights strategic decision intelligence and entrepreneurial dynamics. Track metrics such as consumer spending patterns, technological adoption rates, and demographic shifts that could signal potential business opportunities.

Pro tip: Invest 2-3 hours weekly monitoring trend reports and set up Google Alerts for keywords related to your potential side business niche to stay ahead of market movements.
Step 2: Uncover actionable insights from analytics
Uncovering actionable insights from analytics transforms raw data into strategic business intelligence. By understanding how to interpret and leverage analytical frameworks, you can make informed decisions that propel your side business forward with precision and confidence.
Learning analytics methodologies provide a robust framework for extracting meaningful patterns. Most analytical approaches fall into four critical categories: descriptive, diagnostic, predictive, and prescriptive analytics. Descriptive analytics help you understand what has happened, diagnostic analytics reveal why something occurred, predictive analytics forecast potential future trends, and prescriptive analytics suggest specific actions. For your side business, focus on blending these approaches to create a comprehensive understanding of your market and potential opportunities.
Here’s a quick comparison of analytics methodologies and their role in guiding business strategy:
| Analytics Type | Main Focus | Business Value |
|---|---|---|
| Descriptive | What happened | Tracks past performance |
| Diagnostic | Why it happened | Identifies root causes |
| Predictive | What may happen next | Anticipates future market changes |
| Prescriptive | What to do about it | Recommends actions for growth |
To effectively uncover actionable insights, develop a systematic approach to data analysis. Start by identifying key performance indicators relevant to your specific business niche. Utilize tools like data visualization dashboards, statistical analysis software, and machine learning platforms that can help simplify complex data interpretation. Real-time analytics strategies emphasize the importance of moving beyond retrospective reporting to proactive intervention. This means continuously monitoring your data, identifying emerging patterns, and being prepared to pivot your strategy based on actionable insights.
Pro tip: Create a weekly analytics review ritual where you spend 60 minutes systematically analyzing your business data, comparing current trends against your original hypotheses and adjusting your strategy accordingly.
Step 3: Design business solutions informed by data
Designing data-driven business solutions transforms your entrepreneurial approach from guesswork to strategic precision. This step is about leveraging insights to create innovative solutions that solve real market problems with targeted effectiveness.
Data-driven design methodologies reveal a sophisticated approach to solution development that balances quantitative analysis with human creativity. Start by integrating multiple data sources: customer feedback, market research, behavioral analytics, and performance metrics. Look for intersection points where your data signals genuine market opportunities. This means moving beyond surface level observations and identifying underlying patterns that reveal unmet customer needs or inefficiencies in existing solutions.
To craft effective business solutions, combine quantitative metrics with qualitative insights. Data-informed design processes emphasize the importance of behavioral metrics and user feedback in shaping your approach. Create prototype solutions, test them rapidly, and use data to validate and refine your concepts. This iterative method allows you to develop solutions that are not just data-backed but also user-centered and adaptable to changing market dynamics.
Pro tip: Develop a systematic approach to solution design by creating a data tracking dashboard that captures key performance indicators and user interaction metrics in real time, allowing you to make swift and informed adjustments.
Step 4: Test and refine your business approach
Testing and refining your business approach transforms theoretical concepts into practical, market-ready solutions. This critical stage helps you validate your ideas, minimize risks, and create a resilient business model that can withstand real world challenges.
Systematic business research frameworks emphasize the importance of iterative testing and strategic hypothesis validation. Begin by developing clear, measurable hypotheses about your business concept. Design small scale experiments that allow you to test key assumptions with minimal investment. This might involve creating minimum viable products, conducting targeted customer interviews, or running controlled market simulations that provide concrete feedback on your business potential.
Professional entrepreneurs understand that continuous refinement techniques are fundamental to success. Implement a feedback loop where you consistently collect data, analyze results, and make strategic adjustments. Use methods like the Delphi Technique or pilot studies to gather nuanced insights from potential customers and industry experts. Your goal is to create a flexible approach that can quickly adapt based on real market signals, turning initial concepts into robust business strategies that have been thoroughly battle tested.
Pro tip: Allocate 10% of your initial business development budget specifically for experimental testing and create a structured tracking system to document and learn from every iteration of your business approach.
Step 5: Validate results and optimize for growth
Validating results and optimizing for growth transforms your initial business concept from a promising idea into a scalable, sustainable venture. This stage is about rigorously testing your assumptions and strategically amplifying what works best.
Advanced predictive modeling techniques demonstrate the power of systematic validation in driving performance. Begin by establishing clear key performance indicators that directly measure your business objectives. These metrics should be specific, measurable, and aligned with your core business goals. Track critical indicators like customer acquisition cost, lifetime value, conversion rates, and user engagement to understand the true health of your business model.
The following table summarizes key performance indicators used to validate and optimize business growth:
| KPI | Description | Impact on Growth |
|---|---|---|
| Customer Acquisition Cost | Cost to gain a new customer | Measures marketing efficiency |
| Lifetime Value | Revenue from a customer over time | Assesses long-term sustainability |
| Conversion Rate | Percentage of leads becoming sales | Gauges effectiveness of sales |
| User Engagement | Interaction level with business | Indicates customer loyalty |
Growth optimization requires a disciplined approach of continuous learning and incremental improvement. Implement A/B testing across different aspects of your business from marketing strategies to product features. Create controlled experiments that allow you to isolate and understand the impact of specific changes. Be prepared to pivot quickly when data reveals ineffective strategies, and double down on approaches that demonstrate consistent positive results. Remember that optimization is an ongoing process of refinement, not a one time event.
Pro tip: Establish a weekly growth review ritual where you spend 90 minutes dissecting your key performance metrics, identifying potential optimization opportunities, and documenting actionable insights for immediate implementation.
Unlock Your Side Business Success with Data-Driven Strategy
Launching a profitable side business requires more than just ideas It demands actionable insights, continuous validation, and a clear path guided by reliable data This article highlights the challenges entrepreneurs face like assessing market trends, uncovering insights, and refining business models The risk of blindness to critical data or biases can stall progress and increase uncertainty
At siift.ai, our Intelligent Business Canvas is designed to solve these precise challenges It is a modern founder’s strategy platform that uses AI to guide you step-by-step through ideation, validation, and go-to-market processes With personalized feedback and prioritized actions you get unbiased clarity and a data-driven blueprint built to de-risk your journey Use tools that help you analyze market opportunities like descriptive and predictive analytics and integrate continuous testing as recommended in the article
Are you ready to turn your side business ideas into validated growth engines? Start now with siift.ai Intelligent Business Canvas and access the AI-powered support to transform insights into profitable solutions Discover how seamless it is to design, test, and refine business models tailored for success Visit siift.ai to begin your data-driven entrepreneurship journey today
Frequently Asked Questions
How can I assess current market trends for my side business?
To assess current market trends, begin by gathering data from reputable research platforms that compile global insights. Spend 2-3 hours each week monitoring trend reports and set up alerts for keywords relevant to your niche to stay informed.
What are the key analytics methodologies I should use for my side business?
Focus on four main analytics methodologies: descriptive, diagnostic, predictive, and prescriptive analytics. Blend these approaches to gain comprehensive insights into your market, and create a weekly analytics review to track key performance indicators and adjust your strategy accordingly.
How can I design effective business solutions using data?
Design effective business solutions by combining quantitative metrics with qualitative insights to identify genuine market opportunities. Create a data tracking dashboard to capture key indicators in real time, allowing for swift adjustments based on user interaction and feedback.
What steps should I take to test and refine my business approach?
Begin by developing clear, measurable hypotheses about your business concept and conduct small-scale experiments to test these assumptions. Allocate 10% of your initial business development budget for experimental testing to gather valuable feedback and learn from each iteration.
How can I validate results and optimize my business for growth?
Establish clear key performance indicators that measure your business objectives and track metrics like customer acquisition cost and conversion rate. Set up a weekly growth review to analyze results and identify opportunities for optimization, enabling you to refine your strategies for continuous improvement.
Recommended
- blog | siift | How to Identify Trends for Your Side Business in 2025
- blog | siift | Bootstrapping Strategies: Guide for First-Time Founders
- blog | siift | 7 Innovative Business Ideas for Students to Start Now
- blog | siift | Startup Success Stories: Real Paths to Business Wins 2025
- 10 Data-Driven Marketing Examples from Top Brands (and How to Apply Them) | Reddog Consulting Group