

TL;DR:
- Most founders measure the wrong metrics by focusing on vanity numbers instead of meaningful KPIs aligned with their goals. They often overtrack and neglect to differentiate between leading and lagging indicators, which hampers real-time decision-making. Building a regular, goal-based measurement system using targeted metrics helps create clarity and drives sustainable business growth.
Measuring success is defined as quantifying your progress with meaningful metrics that align directly with your goals and values from the outset. Most founders get this wrong. They chase revenue numbers or social follower counts while ignoring the indicators that actually predict whether their business will survive. The industry standard for evaluating success starts with SMART goals set before any initiative launches, paired with a focused set of key performance indicators (KPIs) that reflect what genuinely matters to your venture. Get that foundation right, and everything else becomes clearer.
How to measure success: choosing the right metrics
The single biggest mistake founders make is tracking everything and learning nothing. Focus on 5–10 key metrics per team to maintain clarity and avoid data overload. That constraint forces you to decide what actually matters before you start measuring.
Your metrics should map directly to your goals. A side project testing product-market fit needs different indicators than a scaling e-commerce brand. The SMART framework gives you a reliable filter: every metric you track should be Specific, Measurable, Achievable, Relevant, and Time-bound. If a metric fails any of those tests, cut it.
Broadly, your KPIs fall into four categories:
- Financial metrics: Revenue growth, gross profit margin, and cash flow. Profitability ratios like Gross Profit Margin reflect sustainable health far better than raw sales volume.
- Customer metrics: Net Promoter Score (NPS), Customer Lifetime Value (CLV), and retention rate. Increasing retention by 5% can boost profits by 25%–95%. That number alone should make retention a top priority.
- Operational metrics: Cycle time, conversion rates, and cost per acquisition. These tell you how efficiently your machine runs.
- Team metrics: Psychological safety scores and goal completion rates. High psychological safety is a foundational driver of productive, high-performing teams.
Pro Tip: Audit your current metrics list. If any metric cannot directly influence a decision you would make this week, remove it. Vanity metrics like total page views or raw follower counts feel good but rarely connect to revenue or retention.
For founders building from scratch, the best startup metrics to track are those tied to validated demand, not activity.
What are leading and lagging indicators?
Leading and lagging indicators are the two fundamental types of business metrics, and confusing them is expensive. Leading indicators predict future performance. Lagging indicators confirm past results. Most founders only watch lagging indicators and wonder why they keep getting surprised.
Here is how to tell them apart and use both:
- Pipeline volume (leading): The number of qualified prospects in your sales funnel predicts next quarter’s revenue before a single deal closes. If pipeline drops this month, revenue drops in 60–90 days.
- Customer satisfaction score (leading): NPS measures likelihood to recommend on a 0–10 scale. A falling NPS warns you about churn before it shows up in retention numbers.
- Quarterly revenue (lagging): This confirms what already happened. It is useful for reporting and trend analysis, but it cannot help you course-correct in real time.
- Customer retention rate (lagging): Retention tells you how well you kept customers over a defined period. Paired with NPS, it creates a complete picture of customer health.
- Employee turnover rate (lagging): High turnover confirms a team problem that likely started months earlier. Psychological safety scores are the leading version of this same signal.
Overreliance on lagging indicators hampers real-time corrections. Build your measurement system so that at least half your tracked metrics are leading indicators. That way, you are steering by what is ahead, not by what is already behind you.
How to build a success measurement framework
A measurement framework is only useful if it exists before your initiative starts. Measurement without a baseline set in advance cannot accurately calculate impact. You cannot know how far you have traveled if you never recorded your starting point.
![]()
Follow this sequence:
Step 1: Set your baseline. Before you launch a campaign, product, or project, record current performance across your chosen KPIs. This is your zero line. Every future measurement is relative to it.
Step 2: Define target ranges, not fixed numbers. Setting targets as ranges such as 25%–35% improvement supports realistic variability and avoids premature discouragement. A fixed target of exactly 30% creates unnecessary failure if you land at 28%.
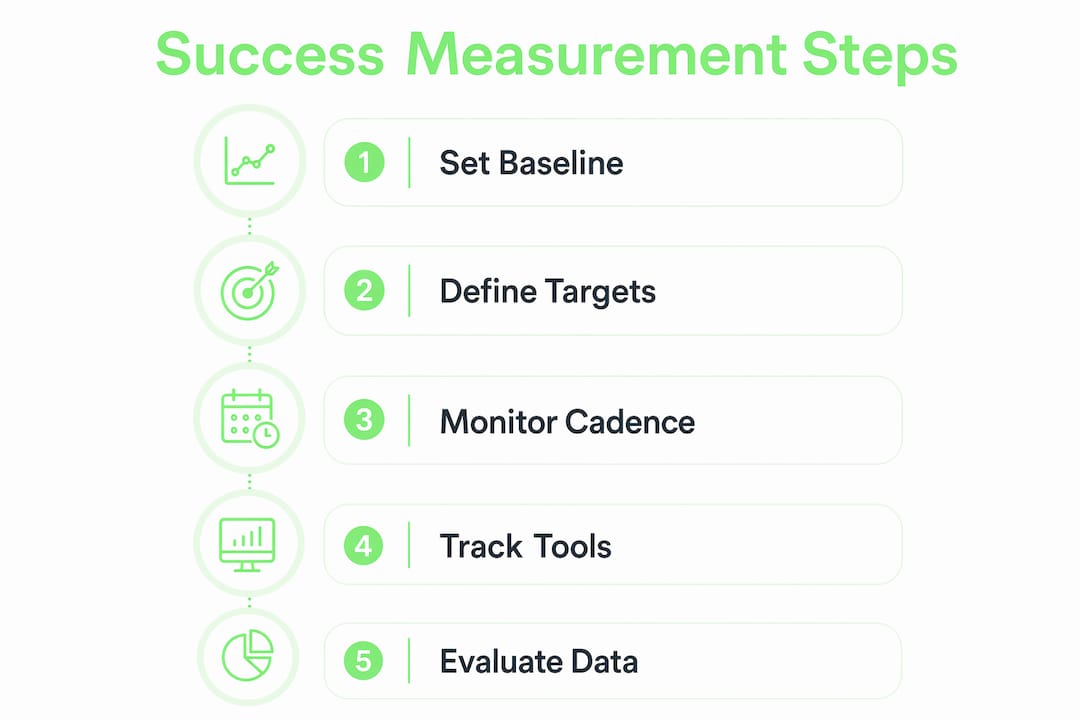
Step 3: Choose your monitoring cadence. Weekly check-ins work for fast-moving projects. Monthly reviews suit steadier operations. The key is regularity. Regular monitoring of metrics, including financial statements and customer feedback, significantly improves the chances of meeting business goals compared to checking only at year-end.
Step 4: Use the right tracking tools. Google Analytics covers web and acquisition metrics. Tableau handles data visualization for more complex datasets. For founders who want startup metrics tracking built into their workflow, purpose-built platforms connect goal-setting directly to measurement.
| Approach | Baseline setting | Target definition | Monitoring frequency |
|---|---|---|---|
| Ad hoc tracking | Rarely set | Fixed number | Irregular |
| Structured KPI framework | Set before launch | Range-based | Weekly or monthly |
| Integrated platform | Automated | Dynamic and adjustable | Continuous |
Pro Tip: Schedule a 30-minute metric review every week on the same day. Consistency beats intensity. A brief weekly check catches drift early; a quarterly deep-dive often finds problems too late to fix cheaply.
Common pitfalls in measuring success
Even founders who understand KPIs fall into predictable traps. Knowing the pitfalls in advance is the cheapest form of insurance.
- Tracking too many metrics. More than 10 KPIs per team creates noise, not insight. Experts recommend limiting to 5–10 critical metrics established before the project starts. When everything is a priority, nothing is.
- Chasing vanity metrics. Follower counts, total downloads, and raw page views feel like progress. They rarely correlate with revenue, retention, or product-market fit. Replace them with metrics tied to real decisions.
- Ignoring qualitative feedback. Numbers tell you what happened. Stakeholder interviews, customer calls, and team retrospectives tell you why. Defining success criteria upfront and tracking continuously enables evidence-based course correction, but qualitative input fills the gaps that data misses.
- Failing to revisit goals. Markets shift. Your metrics should shift with them. A KPI that was relevant in january may be misleading by july. Build a quarterly review of your metric set into your calendar.
- Skipping values alignment. Many founders fail to define personal or business values before setting success metrics, which leads to chasing vanity indicators that lack any connection to real viability. Clarity about what you are building for comes before clarity about what to measure.
How to evaluate your success data and act on it
Collecting data is the easy part. Turning it into decisions is where most founders stall. Evaluation means reading your metrics together, not in isolation.
Start with financial health. Gross profit margin tells you whether your core business model works. Revenue growth tells you whether demand is expanding. If margin is shrinking while revenue grows, you are scaling a problem, not a solution. Pair financial metrics with customer-centric KPIs like CLV and NPS to understand whether growth is sustainable or fragile.
Look for trends, not single data points. One bad week in conversion rate is noise. Three consecutive weeks of decline is a signal. Train yourself to ask: is this a pattern or an anomaly? That question alone will save you from overreacting to normal variance and underreacting to real problems.
Bring your team into the interpretation process. The people closest to customers and operations often spot the “why” behind a metric shift before the data makes it obvious. Psychological safety within teams directly supports honest, productive evaluation conversations.
Pro Tip: When a key metric moves significantly in either direction, write a one-paragraph explanation before you change anything. Forcing yourself to articulate the cause prevents reactive decisions and builds institutional knowledge over time.
For a deeper look at growth metrics for startups, the patterns that separate healthy traction from misleading spikes are worth understanding early.
Key takeaways
Measuring success in business requires setting baselines before you start, tracking 5–10 aligned KPIs, balancing leading and lagging indicators, and reviewing your metric set regularly to stay relevant.
| Point | Details |
|---|---|
| Start with SMART goals | Define Specific, Measurable, Achievable, Relevant, and Time-bound goals before any initiative launches. |
| Limit to 5–10 KPIs | Tracking fewer metrics creates focus; more than 10 per team produces noise, not insight. |
| Balance indicator types | Combine leading indicators like NPS with lagging ones like revenue to enable proactive decisions. |
| Use target ranges | Set improvement targets as ranges (e.g., 25%–35%) to support realistic expectations and motivation. |
| Review metrics regularly | Schedule weekly check-ins and quarterly metric audits to keep your KPIs aligned with current goals. |
Why I think most founders measure the wrong things entirely
Here is the uncomfortable truth I have seen play out repeatedly: founders do not have a measurement problem. They have a values problem. They have not decided what they are actually building or why, so they default to the metrics that feel most impressive in a pitch deck or on a social post.
Revenue is easy to celebrate. Retention is harder to explain. But retaining customers is 5–25 times cheaper than acquiring new ones, and a business with 80% retention and modest revenue is far healthier than one with explosive growth and 40% churn. The numbers that matter most are rarely the ones that get the most applause.
I have also watched founders set rigid targets and then quietly abandon their measurement systems the moment they miss a number. That is why target ranges exist. A range of 25%–35% improvement is not a cop-out. It is an honest acknowledgment that business is variable and that your goal is directional progress, not a single arbitrary figure.
The founders who build durable businesses are the ones who stay curious about their data rather than defensive about it. They treat a declining metric as a question worth answering, not a verdict to hide. That mindset is the real foundation of any measurement system worth building.
— Samim
Siift gives you a clearer picture from day one
Building a measurement system from scratch is genuinely hard when you are also trying to validate an idea, find customers, and figure out your go-to-market. Siift is built for exactly that moment. The platform guides founders step by step through ideation, validation, and strategy, so your goals and metrics are aligned from the start rather than retrofitted later.
With Siift, you are not guessing which KPIs matter for your specific business model. The platform helps you identify the indicators that reflect real traction, not just activity. If you are ready to build with more clarity and confidence, get started with Siift and see what a structured approach to success measurement actually feels like.
FAQ
What is the best way to measure business success?
The best way to measure business success is to align 5–10 KPIs with your SMART goals before any initiative starts, then monitor them on a regular cadence. Combine financial metrics like gross profit margin with customer metrics like NPS and retention rate for a complete picture.
How do you measure success in a startup or side project?
Focus on leading indicators tied to validated demand, such as pipeline volume, conversion rate, and customer satisfaction scores. These predict future performance and allow you to adjust before problems show up in revenue figures.
What are key performance indicators (KPIs)?
KPIs are specific, measurable values that track progress toward defined business goals. Effective KPIs are time-bound, directly tied to decisions, and limited to a manageable number per team to maintain focus.
What is the difference between leading and lagging indicators?
Leading indicators predict future outcomes, such as pipeline volume or NPS. Lagging indicators confirm past results, such as quarterly revenue or annual retention rate. A balanced measurement system uses both.
How often should you review your success metrics?
Weekly check-ins work well for active projects, while monthly reviews suit steadier operations. A quarterly audit of the metric set itself keeps your KPIs aligned with current business priorities and market conditions.