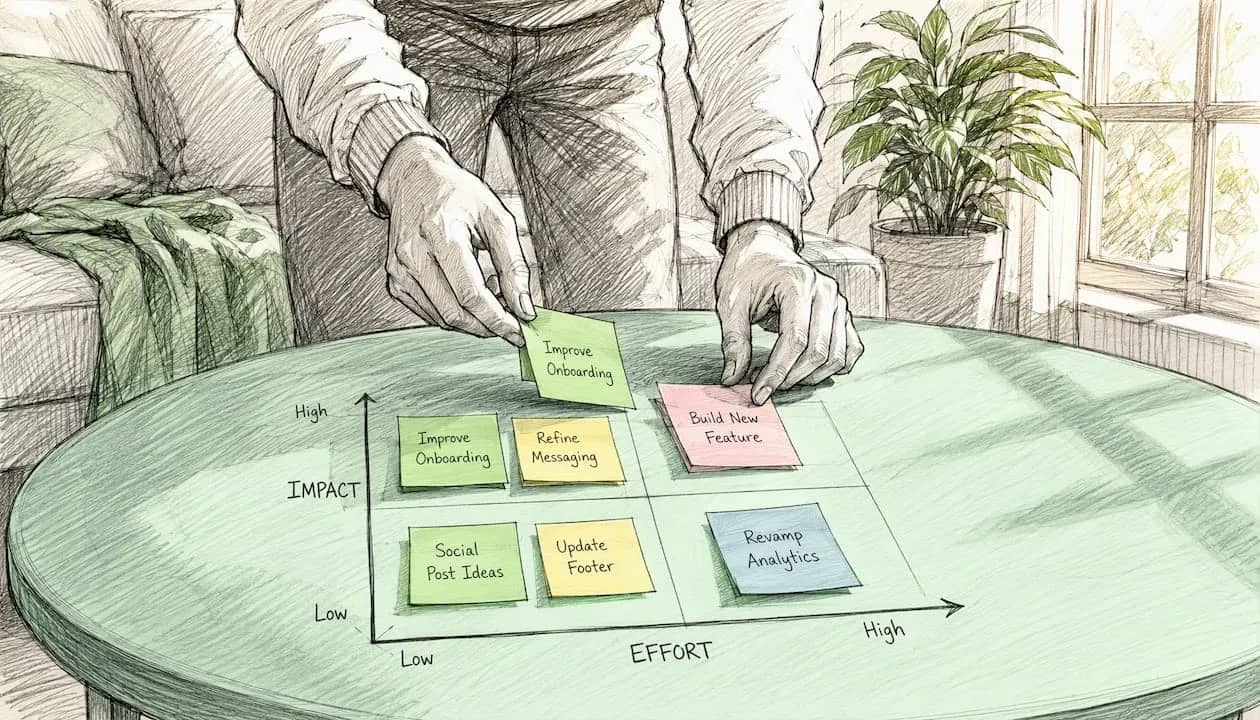
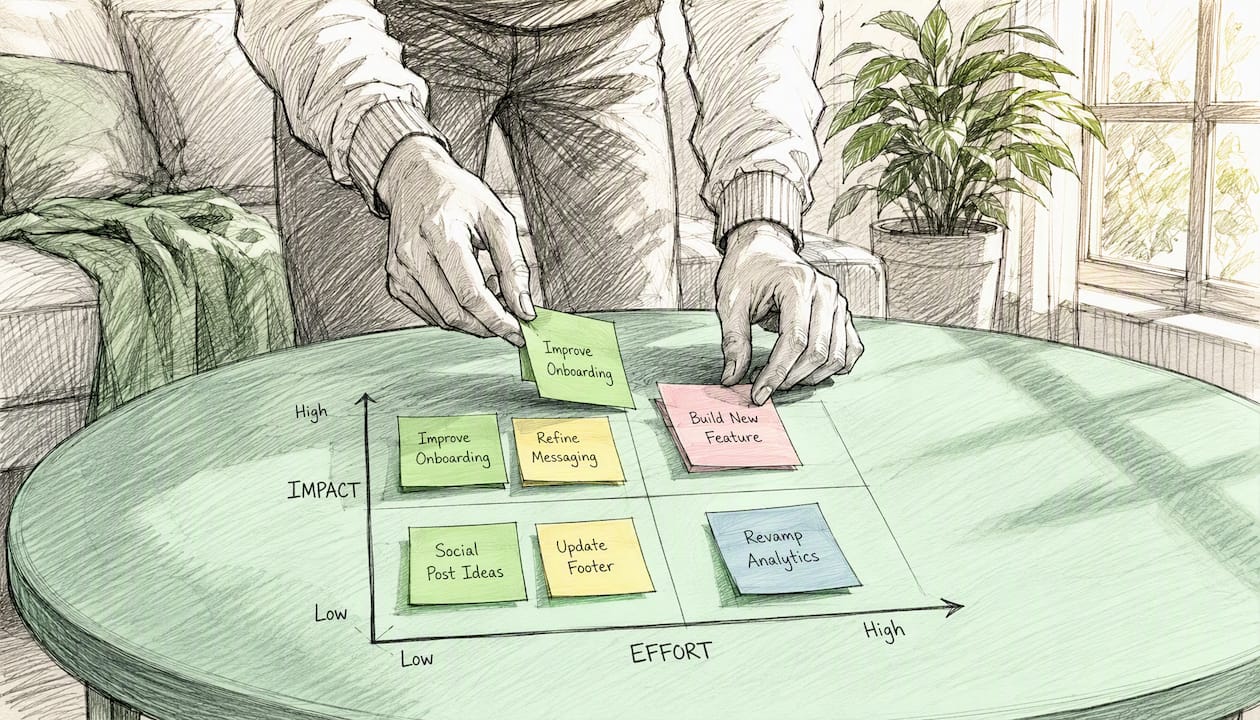
Here’s the shortest path to a defensible roadmap: run quick triage with an Impact–Effort matrix to kill the obvious losers, then rank whatever survives with RICE or Cost of Delay, depending on whether your bottleneck is data or time. That’s it. That’s the whole system, and it works whether you’re a two-person startup or a product org with six squads fighting over the same sprint.
Most teams overcomplicate this. They spend three meetings debating a scoring model before anyone’s mapped a single feature against actual business impact. Don’t do that. Triage first, rank second, decide fast.
Here’s which single framework to start with, depending on your situation:
- Early-stage, thin data: Value vs. Effort or ICE. You don’t have reach numbers yet, so don’t pretend you do.
- Consumer product with usage data: RICE. You have the inputs to make Reach mean something.
- Time-critical, revenue-linked decision: Cost of Delay / CD3. When a deadline or partner window changes the math, use the framework built for economic urgency.
And here’s the six-step loop you can run in your next backlog grooming session: clarify the goal, collect every candidate feature, pick one framework, estimate the inputs, score everything, then resolve dependencies before you lock the final order.
Key Takeaways
Effective feature prioritization combines a fast qualitative filter with a quantitative ranking method matched to the data and time pressure you actually have.
| Point | Details |
|---|---|
| Triage before you score | Use Value vs. Effort to cut obvious losers before running a heavier framework on survivors. |
| Match framework to inputs | Pick ICE for thin data, RICE for reach metrics, and Cost of Delay for time-critical decisions. |
| Record your assumptions | Log the goal link, score, key assumption, and owner for every prioritized feature. |
| Re-score on a cadence | Refresh rankings quarterly at minimum, and immediately when a deadline or dependency shifts. |
| Bring customers in for Kano and Opportunity Scoring | These frameworks fail without real customer survey data behind them. |
| Consider a purpose-built tool | Platforms like siift help teams keep prioritization scores persistent and versioned instead of rebuilt from scratch each cycle. |
Table of Contents
- How Do You Prioritize Features in a Product?
- Which Framework Fits Your Situation?
- How to Run a Feature Prioritization Session
- What Are the Best Feature Prioritization Frameworks?
- What Mistakes Wreck Feature Prioritization?
- RICE and Cost of Delay Templates You Can Use Today
- Where Does Prioritization Fit in Agile Ceremonies?
- What Actually Separates Good Prioritization From Theater
- When Manual Scoring Starts Breaking Down
- Sources
- FAQ
How Do You Prioritize Features in a Product?
You prioritize features by first sorting candidates through a fast qualitative filter, then scoring the survivors with a quantitative model that matches the data you actually have. That’s the two-step pattern behind every credible feature prioritization technique on the market, from RICE to Kano to Cost of Delay.
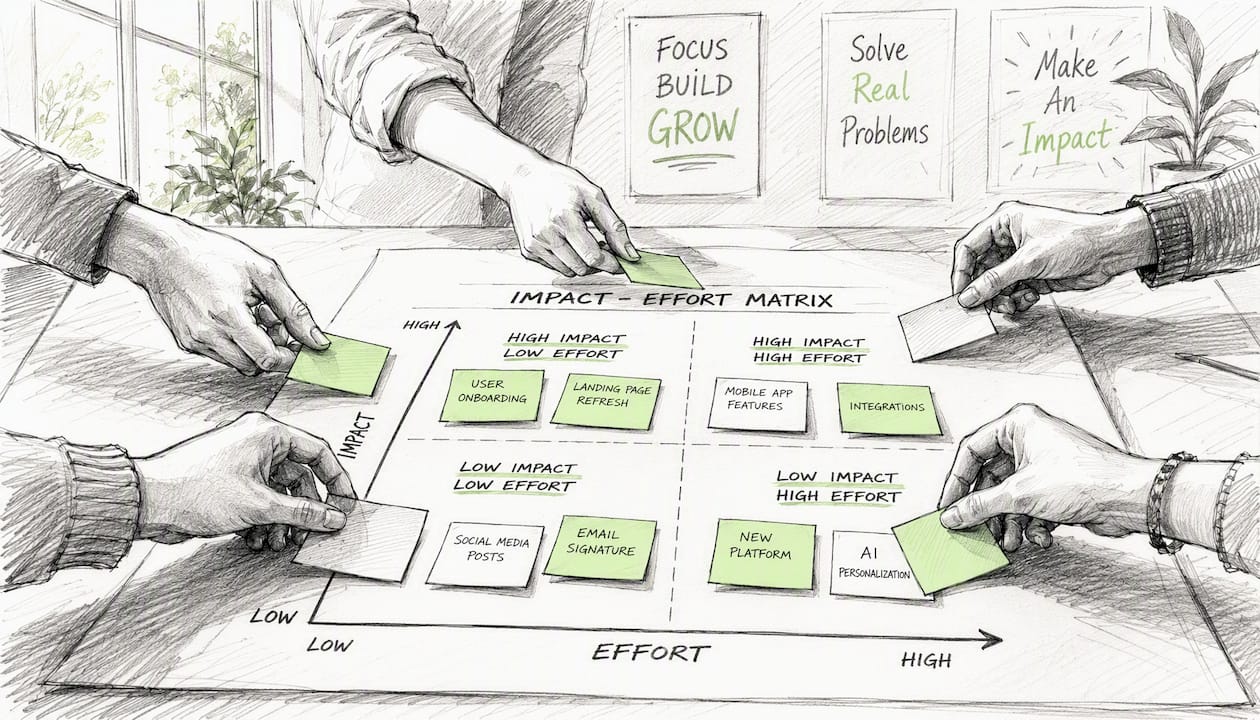
The mistake founders make is skipping straight to a complicated weighted scorecard before they’ve done the cheap filtering. An Impact–Effort matrix takes fifteen minutes and immediately shows you which ideas don’t deserve a deeper look. Plot every candidate feature on two axes, business impact and implementation effort, and you’ll usually find that a third of your backlog lands in the “low impact, high effort” quadrant. Cut those before you waste a single scoring session on them.
Once you’re down to a real shortlist, that’s when a heavier framework earns its keep. RICE, Cost of Delay, or a weighted scorecard all convert opinion into a comparable number. Skipping the triage step and jumping straight to detailed scoring is how teams end up debating decimal points on features that should have been cut in round one.
Which Framework Fits Your Situation?
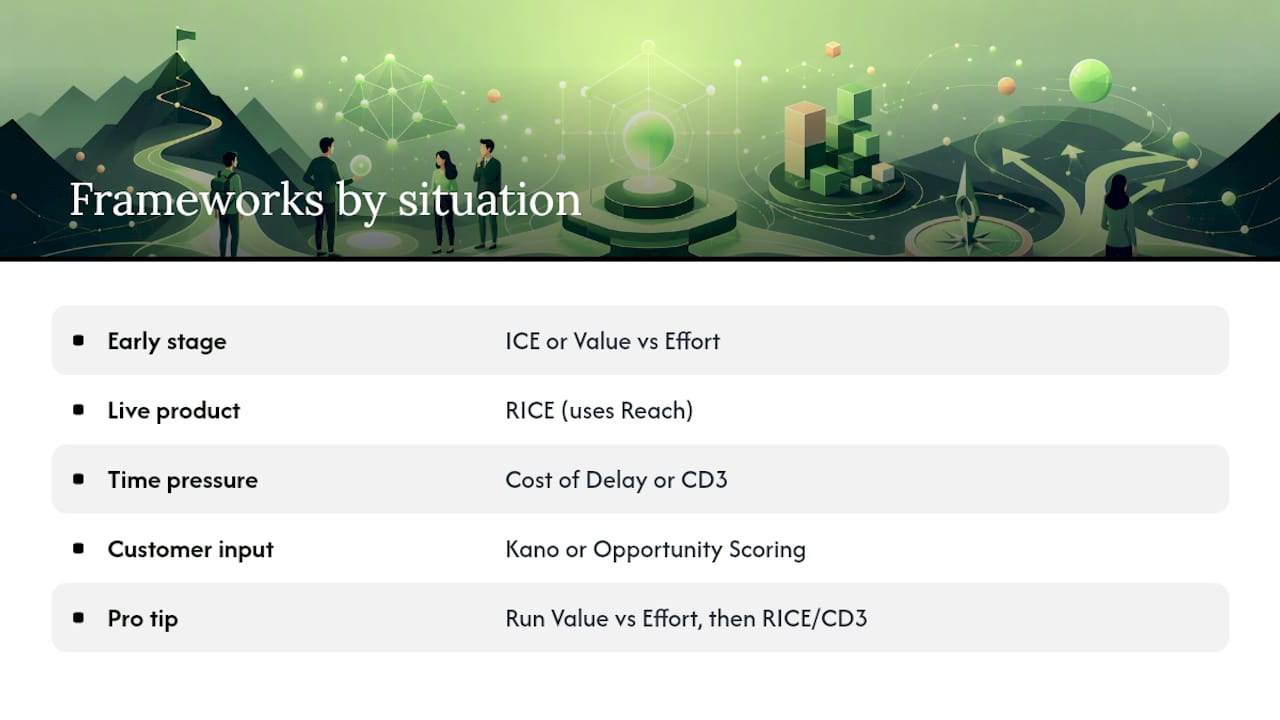
Here’s the fast-match guide. Find your situation, use the framework next to it, and stop second-guessing.
If you’re pre-launch or early-stage with almost no usage data, use ICE or Value vs. Effort. ICE (Impact, Confidence, Ease) is a lighter cousin of RICE that drops the Reach variable entirely, which matters because early-stage teams usually don’t have reliable reach numbers to plug in. Value vs. Effort works even better when you’re moving fast in a workshop setting and just need a visual gut-check the whole team can agree on in one sitting.
If you have a live product with real usage metrics, RICE is your default. It adds Reach back into the equation, which only makes sense once you have analytics telling you how many users or accounts a feature will actually touch. This is the sweet spot for consumer and SaaS products with meaningful traffic.
If you’re up against a hard deadline, a partner integration window, or a revenue cliff, use Cost of Delay or its derivative, CD3. Standard scoring models don’t account for time pressure. A feature that unlocks a $200,000 contract expiring in six weeks needs a different lens than “how many users will touch this,” and Cost of Delay quantifies exactly that urgency as an economic rate.
If the decision hinges on what customers actually want, not what you assume they want, bring in Kano or Opportunity Scoring. Both require direct customer input, and both are the wrong tool if you’re trying to move fast without a survey pipeline in place.
Pro Tip: Combine two frameworks in the same session: run Value vs. Effort as your first-pass filter, then apply RICE or CD3 only to what survives. You’ll cut your scoring workload by half and nobody will accuse you of skipping rigor.
How to Run a Feature Prioritization Session
A good session isn’t a debate club. It’s a structured sequence that produces a ranked list and a paper trail explaining why. Here’s the runbook.
- Clarify the goal. Write down the single business outcome this round of prioritization serves (activation, retention, revenue, a specific launch). Every score you assign later should trace back to this one sentence.
- Collect every candidate. Pull from support tickets, sales asks, analytics gaps, and your own backlog. Don’t pre-filter yet. This is inventory, not judgment.
- Pick your framework. Match it to your situation using the guide above. Announce it before scoring starts so nobody argues about methodology mid-session.
- Calibrate your inputs. This is the step teams skip and regret. Define what a “9” on Impact means versus a “3.” Define effort in actual person-weeks, not vibes. For RICE, agree in advance that Confidence above 80% requires real data, 50 to 80% requires a strong hypothesis, and anything below 50% is a guess dressed up as a number.
- Score together, not solo. Individual scoring produces individual bias. Score as a group, or average independent scores and discuss the outliers.
- Resolve dependencies and decide. Check whether any high-scoring item is blocked by an unscored one. Then lock the ranked list and write down the rationale.
For that last step, keep a simple decision record for each shipped item: which goal it served, its final score, the key assumption behind that score, and who owns the outcome. When someone asks in three months why you built X before Y, you’ll have an answer instead of a shrug.
What Are the Best Feature Prioritization Frameworks?
Here’s the full lineup of criteria for feature selection you’ll actually use, what each one needs from you, and where each one falls apart.
| Framework | Best for | Inputs required | Time to run | Output type |
|---|---|---|---|---|
| RICE | Data-rich consumer/SaaS products | Reach data, opinion-based Impact/Confidence, effort estimate | Quick per item, longer for full backlog | Quantitative rank |
| Impact–Effort matrix | Fast triage, any stage | Opinion (impact and effort estimates) | short workshop | Visual quadrant buckets |
| Kano Model | Understanding feature satisfaction types | Customer survey | Survey plus analysis, days | Categorized features (must-be, performance, delighter) |
| MoSCoW | Time-boxed release planning | Opinion, stakeholder input | Quick workshop | Four priority buckets |
| Weighted scoring | Multi-criteria decisions with defined strategy | Custom weighted criteria, opinion or data | Moderate workshop | Quantitative rank |
| Cost of Delay / CD3 / WSJF | Time-sensitive, economically driven decisions | Business value estimate, duration estimate | Moderate, needs financial input | Quantitative economic rank |
| Opportunity Scoring | Finding underserved needs | Customer survey (importance vs. satisfaction) | Survey plus analysis | Ranked opportunity gaps |
| Buy a Feature | Stakeholder or customer trade-off decisions | Workshop with real or simulated budget | Half-day workshop | Consensus-ranked list |
| Story Mapping | Defining an MVP or release slice | Team knowledge of user journey | Workshop, half-day | Visual release slices |
| ICE | Fast triage, no reach data | Opinion only | Quick per item | Quantitative rank |
A few of these deserve more than a table row.
RICE runs on the formula Reach × Impact × Confidence ÷ Effort. That’s (4,000 × 2 × 0.8) ÷ 2 = 3,200. Score every other candidate the same way, and you’ve got a ranked list that isn’t just whoever argued loudest in the meeting.
Cost of Delay and CD3 work differently. Instead of asking “how good is this feature,” they ask “what does waiting cost us.” If a feature is worth $10,000 a week in unlocked revenue and takes 4 weeks to build, its CD3 is $10,000 ÷ 4 = 2,500. Compare that against a feature worth $6,000 a week that takes 1 week to build: $6,000 ÷ 1 = 6,000. Despite the lower weekly value, the second feature wins because it clears the economic bar faster. Don Reinertsen’s framing of Cost of Delay is the reason WSJF (Weighted Shortest Job First) exists in Scaled Agile circles. It’s the same underlying math with a different name.
Kano, Opportunity Scoring, and Buy a Feature all share one trait: they need customers in the room, not just your product team’s assumptions. Opportunity Scoring specifically hunts for the gap between what customers say matters and what they say they’re satisfied with today, which is often where your best unbuilt features are hiding.
MoSCoW and Weighted Scoring round out the list as workhorse tools. MoSCoW’s four buckets, Must have, Should have, Could have, Won’t have, are fast but weak at ranking within a bucket, which is exactly why teams pair it with something quantitative once the “Must haves” pile gets too big. Weighted scoring lets you build a custom scorecard with your own criteria and weights, useful when your business has a strategic priority (say, enterprise readiness) that generic frameworks don’t capture.
What Mistakes Wreck Feature Prioritization?
Bad prioritization isn’t usually a bad framework. It’s a good framework run badly. Here’s what breaks it, and the fix for each.
- Scoring inflation. Everything gets rated a 9 out of 10 because nobody wants to say their pet feature is mediocre. Guardrail: force relative ranking, not absolute scores. Ask “is this a bigger win than the last thing we scored?” instead of “how good is this on its own?”
- Overfitting your inputs. Teams build an elaborate RICE model with six decimal places of precision on numbers that were guesses to begin with. Guardrail: match your framework’s complexity to your actual data quality. If Impact is a guess, don’t pretend Confidence is a science.
- Ignoring dependencies. A feature scores brilliantly but is blocked by three unscored infrastructure items. Guardrail: map dependencies before you finalize rank, not after you’ve already communicated the roadmap.
- Using the wrong framework for the data you have. Running Opportunity Scoring without a customer survey pipeline, or RICE without reach data, just produces confident-sounding nonsense. Start with the simplest framework your actual inputs support, then graduate to something heavier once you have better data.
Before you even open a spreadsheet, run this readiness check: do you have a clear goal, real (not imagined) data, the right owners in the room, and someone with actual authority to make the final call? If any of those four are missing, fix that first. Scoring exercises don’t fix a missing decision maker.
RICE and Cost of Delay Templates You Can Use Today
Steal these. Here’s a full worked RICE example for a checkout fix, plus a Cost of Delay sketch you can adapt in your next planning doc.
- Set your Reach window. Decide a fixed period, usually a quarter, and estimate how many users or accounts the feature touches in that window. For our checkout fix: 4,000 users per quarter.
- Rate Impact on a fixed scale. Use 3 (massive), 2 (high), 1 (medium), 0.5 (low), 0.25 (minimal). Checkout fix: 2.
- Assign Confidence as a percentage. 100% means hard data, 80% means strong evidence, 50% means a reasonable hypothesis. Checkout fix: 80% (0.8).
- Estimate Effort in person-weeks. Checkout fix: 2 weeks.
- Calculate. (Reach × Impact × Confidence) ÷ Effort = priority score. Rank every other candidate the same way and sort descending.
For Cost of Delay, build a table assigning estimated user/business value per unit time, time criticality level, risk reduction value, and duration, then calculate CD3 scores accordingly for each candidate feature.
Sort by CD3 descending, and you’ve got an economically defensible order, not just a hunch.
If you’re setting up a scoring sheet from scratch, use these columns: Feature name, Reach (12-week estimate), Impact (0.25 to 3 scale), Confidence (percentage), Effort (person-weeks), RICE score, Business value ($/week), Duration (weeks), CD3 score, Owner, Key assumption. Calibrate Confidence by agreeing as a team what evidence justifies each tier before anyone scores a single row, otherwise everyone just defaults to “I feel good about this” at 80%.
Where Does Prioritization Fit in Agile Ceremonies?
Prioritization isn’t a one-time event. It’s a recurring discipline that shows up differently depending on the ceremony.
- Weekly backlog refinement: Run quick triage here. Value vs. Effort or ICE, applied to newly surfaced ideas, keeps the backlog from bloating with unscored junk.
- Sprint planning: This is where you pull already-scored items into commitments. Don’t re-score from scratch here; you’re executing a decision made in refinement or quarterly planning.
- Quarterly or roadmap planning: Reserve RICE and Cost of Delay for this cadence. These are heavier lifts that deserve dedicated time and cross-functional input, not a rushed fifteen minutes at the end of a sprint review.
- Continuous re-scoring: Re-run your ranking whenever new data lands, a deadline shifts, or a dependency clears. A quarterly refresh is the minimum; monthly is better for fast-moving products.
- Carryover items: If something didn’t ship last sprint, don’t assume its score is still valid. Time-sensitive features especially decay in CD3 value the longer they sit.
- Escalation: If two teams are fighting over the same engineering capacity, that’s a cross-team dependency, not a scoring problem. Escalate to whoever owns the shared roadmap instead of re-scoring in circles.
What Actually Separates Good Prioritization From Theater
Here’s the uncomfortable truth: most prioritization frameworks fail not because the math is wrong, but because nobody writes down why a score was what it was. Six months later, someone asks why Feature A shipped before Feature B, and the honest answer is “I don’t remember, we just felt good about it at the time.” That’s not prioritization. That’s a very expensive coin flip with extra steps.
The fix isn’t a fancier framework. It’s discipline around recording assumptions and revisiting confidence scores as new evidence comes in. Treating a RICE Confidence rating as a permanent fact instead of a snapshot in time is one of the more common blind spots teams don’t notice until a low-confidence bet quietly turns into a shipped feature nobody validated. Confidence should trigger discovery work, not get rounded up to “good enough”.
Here’s a fifteen-minute action item: pull your current top five backlog items, run a quick Value vs. Effort plot with your team, and write down the single biggest assumption behind each item’s placement. That’s it. You’ll be surprised how many “obvious” priorities turn out to rest on an assumption nobody’s actually tested.
When Manual Scoring Starts Breaking Down
Spreadsheets work fine until they don’t. The moment you’re re-scoring the same twenty features every sprint, tracking version history across three tabs, or trying to explain to a new hire why a six-month-old RICE score still says what it says, manual scoring becomes the bottleneck it was supposed to solve.
That’s the gap a tool like siift’s startup idea validation platform is built to close. Instead of rebuilding your scoring sheet every planning cycle, siift keeps your prioritization scores persistent, versioned, and tied to the assumptions behind them, so when a Confidence rating needs revisiting, you’re updating one record instead of hunting through old spreadsheet tabs. It also runs scenario comparisons faster than a manual CD3 table, which matters most when a deadline shifts and you need a re-ranked list in minutes, not another meeting. For founders sequencing a launch around real go-to-market timing, siift’s go-to-market planning tools extend that same logic to the release calendar itself. If your backlog has outgrown what a spreadsheet can honestly track, start a free validation flow and see your next roadmap decision scored, recorded, and ready to defend.
Sources
- 5 Prioritization Methods in UX Roadmapping - NN/g
- Cost of Delay framework description and CD3
- 3 Prioritization Techniques All Product Managers Should Know
- Prioritization frameworks | Atlassian
Read the YC piece first if you’re setting up your first scoring sheet. Read the Cost of Delay page first if a deadline is driving the decision. Read NN/g first if customer research is your bottleneck.
FAQ
How do you prioritize features in a product?
Run quick triage with an Impact–Effort matrix first, then score the surviving candidates with RICE or Cost of Delay depending on whether you have usage data or a time-sensitive deadline driving the decision.
How do you prioritize features in Agile?
Handle quick triage during weekly backlog refinement, reserve heavier scoring like RICE or Cost of Delay for quarterly or roadmap planning, and re-score whenever new data or a deadline shift changes the picture.
What are the three prioritization methods most teams start with?
Most teams start with Value vs. Effort for fast triage, RICE for data-rich ranking, and MoSCoW for quick, time-boxed bucketing into Must, Should, Could, and Won’t have categories.
What is a prioritization matrix for features?
A prioritization matrix, most commonly the Impact–Effort matrix, plots each feature’s business impact against the effort required to build it, so high-impact, low-effort items visually surface as your next moves.
When should you bring customers into feature prioritization?
Bring customers in when you’re using Kano, Opportunity Scoring, or Buy a Feature, since all three require direct customer input to work; RICE and Cost of Delay can run on internal data and estimates alone.