

TL;DR:
Measuring customer engagement involves tracking metrics like NPS, CLV, and DAU/MAU to assess relationship health. Accurate analysis and real-time signals are essential for making impactful business decisions and improving retention. Building a continuous measurement and action loop leads to faster growth and longer customer loyalty.
Customer engagement measurement is the practice of quantifying how customers interact with your brand across every touchpoint, from email clicks to in-app sessions to social shares. 73% of customers say customer experience is a crucial factor in purchasing decisions, and 96% say excellent customer service drives brand loyalty. Those numbers tell you one thing clearly: the brands that track engagement with discipline win. This guide gives you the metrics, frameworks, and practical steps to do exactly that.
What are the essential customer engagement metrics you need to track?

The right customer engagement metrics depend on your business model, but a core set applies almost universally. Essential metrics include the DAU/MAU ratio, 30/60/90-day retention, Net Promoter Score (NPS), Customer Lifetime Value (CLV), and Customer Effort Score (CES). Each one measures a different dimension of the customer relationship, so using them together gives you a fuller picture than any single number can.
The metrics that actually matter
Net Promoter Score (NPS) measures loyalty by asking customers how likely they are to recommend your brand on a 0–10 scale. Promoters score 9–10, passives score 7–8, and detractors score 0–6. Your NPS equals the percentage of promoters minus the percentage of detractors.
Customer Lifetime Value (CLV) tells you the total revenue a customer generates over their entire relationship with you. A rising CLV signals that your retention strategies are working. A falling CLV is an early warning sign worth investigating before churn accelerates.
DAU/MAU ratio is the clearest indicator of product stickiness. Track trends over time rather than chasing a universal target number. A ratio climbing from 0.20 to 0.35 over six months tells a better story than a single snapshot ever could.
Customer Effort Score (CES) measures how easy it is for customers to complete a task, like resolving a support issue or completing a purchase. Lower effort consistently correlates with higher retention. If customers feel friction, they leave quietly.
Social media engagement rate uses a straightforward formula: (Total Engagements / Reach or Followers) × 100. For example, 350 interactions from 7,000 followers equals a 5% engagement rate. That benchmark gives you a real comparison point across campaigns and channels.
Pro Tip: Segment your metrics by customer lifecycle stage. A new user’s DAU/MAU ratio means something very different from a six-month customer’s. Mixing them together produces averages that mislead everyone.
Metric | What it measures | Business signal |
|---|---|---|
DAU/MAU ratio | Daily vs. monthly active users | Product stickiness and habit formation |
NPS | Likelihood to recommend | Loyalty and word-of-mouth potential |
CLV | Total revenue per customer | Long-term profitability and retention health |
CES | Ease of customer task completion | Friction points in the customer experience |
Social engagement rate | Interactions relative to audience size | Content resonance and community strength |
How to collect and organize customer engagement data effectively
Good data collection starts with defining your metrics consistently across every system you use. A “session” in your analytics platform should mean the same thing as a “visit” in your CRM. Without that alignment, you end up comparing apples to motorcycles.
Key data sources to connect
Your main sources of engagement data fall into four categories: in-app behavioral data, CRM records, customer surveys, and social or community activity. Each source captures a different layer of the customer relationship. In-app data shows what customers do. CRM data shows what they buy and when. Surveys reveal what they feel. Social data shows how they talk about you publicly.
Survey tools that capture NPS, CES, and CSAT scores are non-negotiable for any serious engagement program. These qualitative signals fill the gaps that behavioral data misses. A customer can log in daily and still be one bad support experience away from churning.
Advanced tracking via custom JavaScript events, such as monitoring text highlighting and copying, reveals stronger engagement signals than standard page view counts. A reader who copies a paragraph from your blog is far more engaged than one who bounces after 10 seconds. That distinction matters when you are evaluating content strategy.
Pro Tip: Build a single engagement data dictionary before you connect any tools. Define every metric, its source, and its calculation method in one shared document. This prevents the “we measure it differently” argument from derailing every quarterly review.
Tool category | Data type collected | Best used for |
|---|---|---|
Product analytics platforms | In-app events, session depth, feature usage | Behavioral engagement tracking |
CRM systems | Purchase history, contact frequency, lifecycle stage | Relationship and revenue tracking |
Survey tools | NPS, CES, CSAT scores | Sentiment and effort measurement |
Social listening platforms | Mentions, shares, comments, sentiment | Brand perception and community health |
How do you analyze and interpret customer engagement metrics?
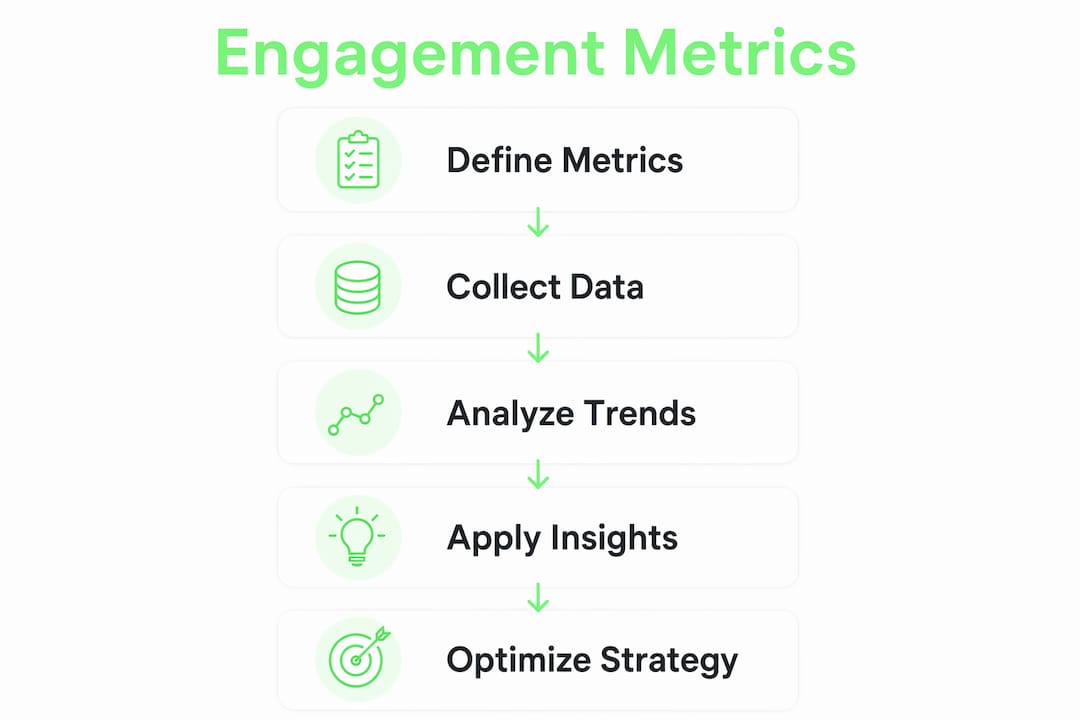
Raw numbers without context are just noise. The four-step engagement analytics framework gives you a repeatable process: signal detection, segmentation, intervention, and measurement. Run this cycle consistently and your engagement data starts telling you what to do next, not just what happened last quarter.
Here is how to apply it in practice:
Detect signals. Identify which metrics are moving and in which direction. A drop in 30-day retention or a spike in CES scores both qualify as signals worth investigating.
Segment your audience. Break the signal down by cohort, channel, or lifecycle stage. Tracking metrics at different lifecycle stages offers clearer insights than one-size-fits-all approaches. A retention drop among new users requires a different response than one among long-term customers.
Intervene deliberately. Design a specific response: a re-engagement campaign, a product fix, a support workflow change. Match the intervention to the segment, not to the overall average.
Measure the outcome. Compare the cohort that received the intervention against a control group. Did retention improve? Did CES scores drop? If yes, scale it. If not, iterate.
The shape of your 30/60/90-day retention curve tells you more than the absolute retention number. A curve that flattens after day 30 indicates sustained engagement. A curve that keeps falling signals a fundamental product or experience problem. Read the shape, not just the endpoint.
Weighted composite engagement scoring takes this further. Assigning 40% to frequency, 30% to depth, 20% to breadth, and 10% to sentiment improves predictive accuracy for retention. This approach rewards customers who engage deeply and consistently, not just those who log in once a week to check a notification.
Pro Tip: Test your composite score against actual retention data every quarter. If your highest-scoring customers are still churning, your weights are wrong. Adjust until the score predicts behavior, not just activity.
How to troubleshoot common challenges in engagement measurement
The most common measurement failure is not a data problem. It is a definition problem. Misalignment of metrics purpose, specifically confusing relationship health metrics with operational metrics or longitudinal ones, causes teams to draw wrong conclusions and make bad decisions.
Three fixes address most measurement problems:
Standardize definitions across teams. Marketing, product, and customer success must agree on what “active user” or “engaged customer” means. Disagreement here creates data silos that no tool can fix.
Prioritize metrics tied to business goals. Not all engagement metrics have equal business impact. A high social engagement rate means little if it does not correlate with conversion or retention. Pick the metrics that connect directly to revenue or loyalty outcomes.
Replace vanity metrics with intent signals. High-intent behaviors like return visitor rates over extended periods provide better engagement signals than page views. Pair these with bounce rate impact data to understand which content actually holds attention.
“Measuring engagement without linking it to business goals usually results in vanity metrics and ineffective actions. The number that looks good in a slide deck is rarely the number that drives a decision.”
Cohort analysis is your best tool for continuous refinement. Compare customers who joined in january against those who joined in march. If one cohort retains better, find out why and replicate it. This is how measurement becomes a growth engine rather than a reporting exercise.
How to use customer engagement insights to drive business growth
Engagement data is only valuable when it changes what you do. Turning insights into action is the step most teams skip, and it is the step that separates growing businesses from stagnant ones.
Here is where engagement insights translate directly into growth decisions:
Personalization. Customers who engage with specific features or content categories tell you what they value. Use that signal to tailor your messaging, recommendations, and product experience to match their behavior.
Feature adoption. Low engagement with a core feature is a product signal, not just a marketing one. It tells you the feature needs better onboarding, clearer positioning, or a redesign.
Content strategy. High engagement on specific topics reveals where your audience’s real interest lies. Double down on those topics and cut the ones that generate views but no meaningful interaction.
Customer support optimization. Rising CES scores in a specific support category point to a process or product problem. Fix the root cause instead of just training your support team to apologize faster.
Retention and loyalty programs. Customer lifetime value grows when you identify your highest-engagement customers and invest in keeping them. Loyalty programs built around actual engagement patterns outperform generic discount-based approaches every time.
Improving user engagement is not a one-time campaign. It is a continuous loop of measurement, interpretation, action, and re-measurement. The businesses that build this loop into their operating rhythm grow faster and retain customers longer than those that treat engagement as a quarterly report.
Key Takeaways
Effective customer engagement measurement combines the right metrics, consistent data collection, and a repeatable analysis framework tied directly to business goals.
Point | Details |
|---|---|
Track a core metric set | Monitor DAU/MAU, NPS, CLV, CES, and retention curves as your baseline engagement stack. |
Define metrics consistently | Align definitions across marketing, product, and customer success before connecting any tools. |
Read retention curve shapes | A flattening 30/60/90-day curve signals sustained engagement better than any absolute number. |
Use weighted composite scoring | Blend frequency, depth, breadth, and sentiment to predict retention more accurately. |
Link every metric to a goal | Metrics not tied to a business outcome produce vanity data, not decisions. |
The number that actually matters is the one you act on
Here is something I have seen trip up even experienced marketing teams: they build a beautiful engagement dashboard, fill it with 20 metrics, and then make the same decisions they would have made without it. The dashboard becomes a comfort object, not a decision tool.
The mindset shift that changes everything is deceptively simple. Stop asking “how engaged are our customers?” and start asking “which engagement signal predicts the outcome we care about most?” For a SaaS product, that might be the DAU/MAU ratio predicting 90-day retention. For an e-commerce brand, it might be repeat purchase rate predicting CLV. The specific metric matters less than the discipline of connecting it to a real outcome and acting when it moves.
I have also watched teams get burned by churn analysis that came too late. They measured engagement beautifully but only looked at the data monthly. By the time the signal appeared in the report, the customer was already gone. Real-time or weekly signal detection is not a luxury in 2026. It is table stakes.
The emerging trend worth watching is AI-assisted engagement scoring. Composite models that blend behavioral signals with sentiment data are getting sharper and faster. The founders and marketers who build these systems now will have a compounding advantage over those who wait until the tools become obvious.
— Samim
Siift helps you build the measurement foundation first
Most founders and marketers skip straight to tactics without validating whether they are measuring the right things for their specific business model. Siift’s agentic AI platform is built to fix that. It guides you through a structured process of validating your customer engagement strategy before you commit resources to the wrong metrics or the wrong channels. The Validate Before You Build program gives you a clear framework for identifying which engagement signals actually matter for your growth stage. If you want to measure with purpose and act with confidence, that is the place to start.
FAQ
What is customer engagement measurement?
Customer engagement measurement is the practice of quantifying how customers interact with your brand across touchpoints using specific metrics like NPS, CLV, DAU/MAU ratio, and retention rates. These metrics together reveal the health of your customer relationships.
Which customer engagement metric is most important?
No single metric is universally most important. The DAU/MAU ratio best measures product stickiness, while NPS best captures loyalty. The right priority depends on your business model and the specific growth outcome you are targeting.
How do you calculate social media engagement rate?
The standard formula is (Total Engagements / Reach or Followers) × 100. For example, 350 interactions from 7,000 followers produces a 5% engagement rate.
What is a vanity metric in customer engagement?
A vanity metric is a number that looks positive but does not predict a meaningful business outcome. Page views and follower counts are common examples. Return visitor rates and retention curve shapes are stronger signals of genuine engagement.
How often should you review customer engagement metrics?
Review high-frequency behavioral metrics like DAU/MAU weekly and relationship metrics like NPS and CLV monthly. Waiting for quarterly reviews means you are always reacting to problems that could have been caught and fixed weeks earlier.