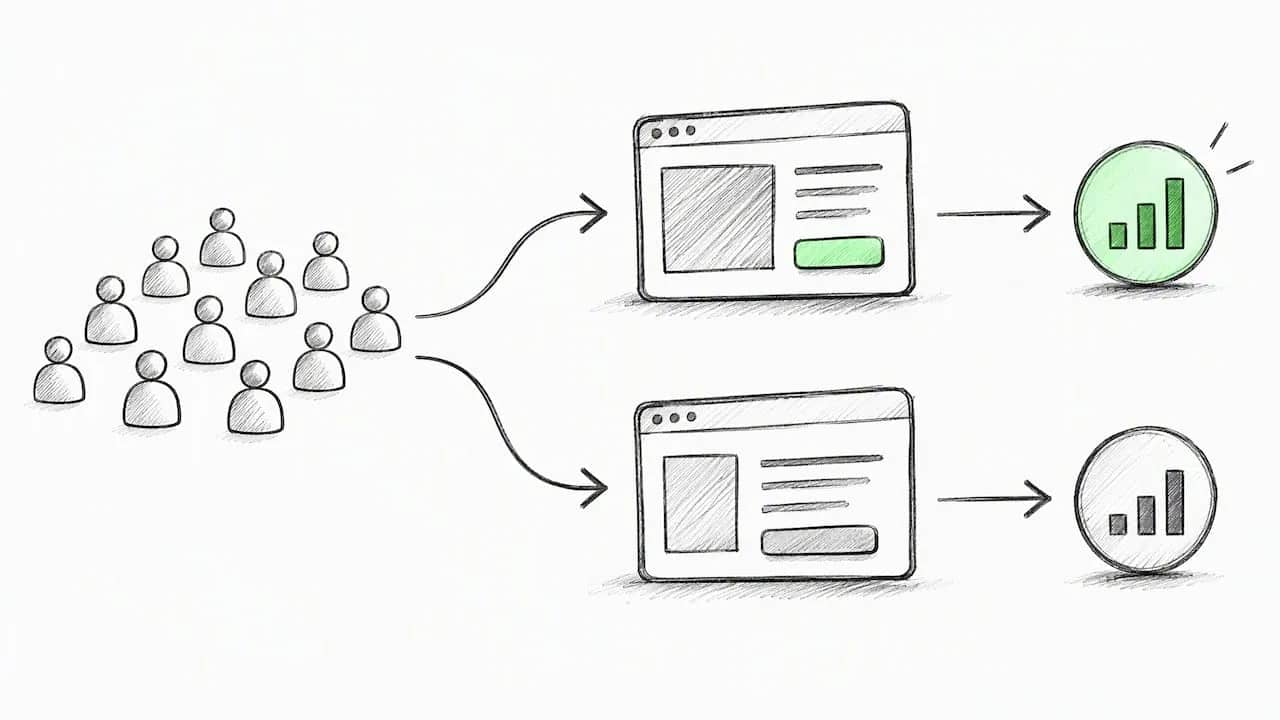

A/B testing is a controlled experiment that shows two or more versions of something, a page, an email, a button, randomly splits groups of people, then measures which version performs better against one metric you picked in advance. It replaces guessing about what customers want with actual evidence. Done well, it’s one of the most reliable ways to learn whether a change helps, hurts, or does nothing. Done sloppily, it can hand you a confident, wrong answer.
TL;DR:
- Choose one primary metric, calculate sample size in advance, and target 80% to 95% power based on your minimum meaningful effect before launching.
- Daily peeking can push a nominal 5% false positive rate as high as 40%; set a fixed stopping rule or use sequential methods.
- Test headlines, calls to action, and form friction first; pricing changes need longer windows, churn and support ticket guardrails, and a rollback threshold.
- Avoid standard A/B tests when traffic cannot reach a trustworthy sample size or marketplace spillovers expose one group to another group’s changes.
- Run an A/A test before trusting a platform; a significant difference between identical versions points to faulty randomization or tracking, not a product effect.
Table of Contents
- What A/B Testing Is and How It Actually Works
- Why A/B Testing Matters More Than Gut Instinct
- What You Can Actually A/B Test
- How to Run a Valid A/B Test, Step by Step
- Statistics and the Mistakes That Quietly Ruin Results
- Practical Examples: Email, Landing Page, and Pricing
- Choosing Your Testing Approach and Tools
- When A/B Testing Isn’t the Right Tool
- Where Experimentation Fits Inside a Bigger Validation Plan
- Tests Are a Habit, Not a Hack
- Where siift Fits Alongside Your Testing Program
- FAQ
- Sources
What A/B Testing Is and How It Actually Works
Here’s the mechanic underneath the buzzword: you take your existing version (the control) and a new version (the variant), then randomly assign each visitor, user, or session to one or the other. Random assignment is the whole point. It’s what lets you say “this difference happened because of the change” instead of “this difference happened because weekend traffic behaves differently.”
Before you launch anything, you need to settle on one number that defines success. Practitioners call this the Overall Evaluation Criterion, or OEC, a single primary metric you’re optimizing for, chosen before you see any results. According to Nielsen Norman Group, A/B testing is fundamentally a randomized controlled experiment, and the analysis relies on hypothesis testing to establish that the effect you’re seeing is actually caused by your change, not noise.
A few terms worth knowing cold:
- Control: the existing version, your baseline for comparison.
- Variant: the new version you’re testing against the control.
- Experimentation unit: the thing being randomized, usually a user or a session, not a page view.
- OEC: the one metric that decides whether the test wins or loses.
Once you’re comfortable with the basic two-way split, two extensions show up constantly in practice. A/B/n testing just adds more variants (B, C, D) against the same control, useful when you have several credible ideas and enough traffic to split further. Multivariate testing changes multiple elements at once (headline and image and CTA, say) and measures how combinations interact, which demands considerably more traffic to reach a clean answer. For most teams starting out, a simple two-way A/B test teaches you more per unit of effort than either variant.
Why A/B Testing Matters More Than Gut Instinct
Every website and product has a finite amount of traffic. A/B testing is how you squeeze more value out of that traffic instead of just hoping for more of it. Instead of redesigning a page based on someone’s opinion in a meeting, you let actual visitor behavior settle the argument.
The upside compounds in ways that aren’t obvious at first glance. Variance-reduction techniques like CUPED, which uses pre-experiment data to strip out noise, let teams detect smaller, real effects without needing more traffic, and some of the largest online experimentation programs have reported individual test winners delivering revenue increases near 10% compared to their controls.
A single well-run test rarely transforms a business overnight. CUPED and related regression-adjustment methods are now standard in mature experimentation programs precisely because most real wins are incremental, and catching them reliably requires squeezing extra sensitivity out of the data you already have.
What testing actually buys you:
- A defensible reason to ship a change, backed by evidence rather than seniority.
- A record of what didn’t work, which stops your team from relitigating the same bad idea twice.
- A habit of measuring impact before scaling a decision across your whole funnel.
The honest caveat: testing tells you what happened with your traffic, during your test window, for the metric you picked. It doesn’t tell you why, and it won’t rescue a fundamentally weak offer.
What You Can Actually A/B Test
Almost anything with a measurable outcome qualifies, but some elements consistently move metrics more than others, and some carry more risk if you get them wrong.
On pages, the highest-leverage targets are usually the headline, the hero image, and the call-to-action, both its wording and its color. These sit above the fold, get seen by nearly everyone, and tend to produce the clearest signal relative to effort.
In forms and funnels, small frictions cost more than people expect. Field count, microcopy (the one-line hints next to inputs), and progress indicators that show how many steps remain all affect completion rates, and they’re cheap to test because the changes are small and reversible.
In campaigns, subject lines, send times, and offer framing are the classic trio. They’re also low-risk: a losing variant costs you one send, not a redesign.
Common test candidates, roughly in order of how quickly they’re worth trying:
- Headlines and hero copy, since they set first impressions for nearly every visitor.
- CTA text and button color, which are cheap to change and easy to measure.
- Form length and microcopy, where small friction reductions often lift completion.
- Email subject lines and send times, which carry almost no implementation risk.
- Pricing and offer structure, which move revenue but need longer test windows and tighter guardrails.
That last category deserves a flag: pricing experiments touch revenue and customer trust directly, so they’re worth running, just not casually, and never without a clear stopping rule and a plan for what happens to customers in the “losing” variant.
How to Run a Valid A/B Test, Step by Step
This is where most tests quietly go wrong, not in the idea, but in the execution. Here’s a runbook that keeps you honest.
- Write a specific hypothesis and pick one OEC. “Changing the CTA from ‘Sign Up’ to ‘Start Free Trial’ will increase trial starts” is testable. “Let’s make the page better” is not. Choose one primary metric before you look at any data, and resist the urge to add five “nice to know” metrics that you’ll later cherry-pick from.
- Calculate your sample size and power before launch. This step gets skipped constantly, and it’s the single biggest source of bad test results. According to the Stanford guide to controlled experiments, designing a valid experiment means pre-determining sample size and statistical power, commonly targeting 80 to 95% power, before you ever flip the switch. Power calculators (free ones exist from Evan Miller and Optimizely) take your baseline conversion rate, the minimum lift you care about, and your desired power to spit out a required sample size.
- Randomize consistently. Assign users via a stable identifier, a cookie or logged-in user ID, so the same visitor always sees the same variant across sessions. Inconsistent exposure is a quiet killer of valid results; if someone sees the control on Monday and the variant on Wednesday, your data is contaminated and you may not even notice.
- Pre-register your stopping rule, then stick to it. Decide your sample size and test duration in advance, and don’t peek at results daily hoping for significance to appear. The Stanford guide is blunt about this: repeatedly checking results and stopping as soon as something looks significant, commonly called peeking, inflates your false-positive rate well beyond what you’d expect. If your team can’t resist checking daily, either lock the results dashboard until the pre-set sample size is hit, or switch to a sequential testing method built for continuous monitoring.
- Run the test, watch guardrail metrics, then analyze properly at the end. Guardrail metrics (page load time, error rates, unsubscribe rates) make sure your winning variant isn’t quietly breaking something else. When the test concludes, report the effect size and confidence interval, not just whether a p-value crossed 0.05. A tiny, statistically significant lift might not be worth the engineering cost to ship permanently.
Pro Tip: Run an A/A test (two identical experiences, split randomly) on your platform at least once before trusting it with real decisions. If an A/A test shows a “significant” difference, your tooling or randomization has a bug, not your product.
The stopping-rule step deserves one more beat, because it’s where the actual statistics get interesting. Fixed-horizon testing, the classic approach, requires you to commit to a sample size and a single analysis point. If you want to monitor results continuously without destroying your error rate, you need sequential or always-valid methods designed specifically for that, which typically require modestly larger total sample sizes to preserve the same statistical power. That trade-off, a bit more traffic in exchange for the freedom to look whenever you want, is often worth it for teams who can’t realistically enforce discipline around not peeking.
Confidence levels matter here too. Most practitioner guidance settles on a 95% confidence level as the default, meaning you’re accepting a 5% chance of a false positive when there’s truly no effect, assuming the test was run correctly and the stopping rule was respected. That assumption is doing a lot of work, which brings us to the next section.

Statistics and the Mistakes That Quietly Ruin Results
Most A/B testing failures aren’t conceptual, they’re statistical hygiene problems. Here are the ones that bite the most.
Peeking is the big one. Checking your results dashboard daily and stopping the moment you see a “win” feels responsible but does the opposite. One analysis found that continuous monitoring with optional stopping can push the real false-positive rate from a nominal 5% up to 20 to 40% in common testing scenarios, meaning what looks like a confident result is often just noise that happened to cross a threshold at the moment you looked. The fix is organizational (lock the dashboard until your pre-set sample size is reached) or statistical (use sequential testing with always-valid confidence sequences, which lets you monitor continuously without that inflation, at the cost of needing somewhat more traffic to hit the same power).

Underpowered tests are the quieter problem. If your sample size was never calculated to detect the effect size you care about, a “no significant difference” result doesn’t mean there’s no effect, it means your test couldn’t have found it even if it existed. Running a test on low-traffic pages without adjusting your expectations is a common beginner trap; the Stanford guide suggests combining A/A tests, pooled historical priors, and variance reduction rather than expecting a single short test on thin traffic to tell you much.
Statistical significance isn’t the same as business significance. A test can hit p < 0.05 while the actual effect size is too small to matter, or the confidence interval is so wide that the “true” lift could be anywhere from a rounding error to a real win. Report the interval, not just the pass or fail.
A few more traps worth naming:
- Running many simultaneous tests or metrics without correcting for multiple comparisons, which raises your odds of a false “win” by chance alone.
- Slicing results by segment after the fact (mobile users, new visitors) until something looks significant, a version of peeking applied to subgroups instead of time.
- Trusting a platform’s randomization and tracking blindly instead of validating it with an A/A test first.
- Treating a borderline result as a win because the team wanted it to be true.
Bayesian approaches get pitched sometimes as an escape hatch from all this. They sidestep the p-value peeking problem in a statistical sense, but they’re not a free pass: they require defensible priors and disciplined decision rules of their own, and sloppy priors just relocate the problem rather than solving it.
Practical Examples: Email, Landing Page, and Pricing
Theory is fine, but three short scenarios make this concrete.
-
Email subject line test. Hypothesis: a subject line with a specific number (“Save 20% this week” vs. “Big savings this week”) increases open rate. OEC: open rate. Before sending, calculate the sample size needed to detect your minimum meaningful lift, say a 2-point difference in open rate, at your chosen power. Split your list randomly, send both versions at the same time to control for timing effects, and wait for your full pre-calculated sample before declaring a winner. If the specific-number subject line wins with a tight confidence interval, roll it into your standard templates; if the interval is wide, treat it as inconclusive rather than a verdict.
-
Landing page CTA test. Hypothesis: changing the CTA button from “Learn More” to “Start Free Trial” increases trial signups. OEC: signup rate, not clicks, since a click that doesn’t convert to a signup isn’t the outcome you actually care about. Randomize at the visitor level using a persistent cookie so return visitors stay in the same group. Set your rollout criteria before launch, something like “ship the winner if it clears a 95% confidence level and the lift exceeds your minimum detectable effect,” so you’re not negotiating the bar after seeing the number.
-
Pricing experiment sketch. Hypothesis: a new pricing tier increases average revenue per user without raising churn. This one needs a longer time horizon than a headline test, because revenue and churn effects take weeks or months to show up fully, not days. Guardrail metrics matter enormously here: track churn and support ticket volume alongside revenue, and pre-commit to reverting if churn moves past an agreed threshold, regardless of what revenue is doing. Pricing tests reward patience and punish shortcuts more than any other category on this list.
Choosing Your Testing Approach and Tools
Most teams default to fixed-horizon testing (set a sample size, run, analyze once) because it’s simple and well understood. Switch to sequential or always-valid methods when your team genuinely can’t resist checking results early, or when test velocity matters more than a few extra days of traffic. Bayesian approaches suit teams comfortable building and defending priors, and who want results framed as probabilities rather than p-values.
Reach for multivariate or factorial designs only when you have enough traffic to support them and a real question about how elements interact; otherwise a sequence of simple A/B tests will teach you faster.
A few implementation notes that save headaches later:
- Server-side testing avoids the flicker and SEO concerns of client-side tools but takes more engineering time to set up.
- Instrumentation and tracking accuracy matter as much as the statistics. Consistent randomization and clean event logging prevent false positives that have nothing to do with your actual change.
- Whatever platform you pick, run an A/A test on it first to confirm it’s not quietly broken.
For teams wanting a deeper read on conversion-focused testing tactics once the fundamentals are solid, babylovegrowth.ai’s guide to CRO tactics walks through practical implementation ideas that pair well with a disciplined testing process.
When A/B Testing Isn’t the Right Tool
Testing is powerful, not universal. A few situations where it breaks down or becomes actively misleading:
- Two-sided marketplaces and networked systems, where a change shown to one group spills over and affects the other group, break the independence assumption standard A/B tests rely on. Stanford’s explainer on A/B testing notes that interference and network effects undercut the isolation a clean experiment needs.
- Low-traffic sites often can’t reach the sample size needed for a trustworthy result in a reasonable timeframe, which means a “we tested it” claim may really mean “we ran an underpowered test and got lucky or unlucky.”
- Privacy and ethical constraints matter when a test could materially disadvantage one group of users, manipulate emotionally sensitive content, or collect data without appropriate consent.
- Organizational obstacles can undo good statistics entirely. A HiPPO (highest paid person’s opinion) overriding a clean test result, or shipping a change before instrumentation can even measure its effect, wastes the whole exercise.
Where Experimentation Fits Inside a Bigger Validation Plan
A/B testing is a sharp, specific tool. It tells you whether B beat A on one metric, for the traffic you ran it on. It doesn’t tell you whether you’re building the right thing in the first place, which is a different, earlier question entirely.
That’s the gap a structured validation process is meant to close, and it’s where our resources on personalizing MVP testing with AI-driven experiments and analyzing customer feedback to uncover real needs go deeper. For founders moving fast, our step-by-step framework for validating ideas in one to two weeks shows how to sequence qualitative validation before you’re even ready to run your first split test.
Tests Are a Habit, Not a Hack
Here’s the uncomfortable truth: most A/B tests don’t “win.” They come back flat, or worse, they contradict the thing you were sure would work. That’s not failure, that’s the method doing its job, and treating a null result as useful data (not a wasted sprint) is what separates teams that actually get smarter over time from teams that just run tests to feel busy.
The real unlock isn’t a single clever test. It’s building the instrumentation, the roadmap discipline, and the stakeholder buy-in to run tests consistently enough that the noise cancels out and the signal compounds. Patience is the unfair advantage nobody wants to talk about.
— Samim Safaei
Where siift Fits Alongside Your Testing Program
A/B testing answers “does B beat A.” It doesn’t answer “are we even testing the right thing,” and that question is where a lot of founder time quietly disappears. Our New Business OS exists for that earlier stage: structured, step-by-step guidance through ideation, validation, and go-to-market, so the hypotheses you eventually test come from a mapped strategy instead of a hunch in a Slack thread.
We’re not a replacement for your testing platform, and we won’t claim to be. We’re the layer that helps you decide what’s worth testing in the first place, filtering out blind spots before you spend traffic finding out the hard way. If you’re building toward your first real experiments, our startup idea validation tools can help you get there with a clearer strategy, and the Discover plan starts at $29 per month per user if you want to try it on your own idea.
FAQ
What does AB testing mean?
A/B testing means randomly splitting an audience between two versions of something, a control and a variant, to measure which one performs better on a single pre-chosen metric. It’s a controlled experiment, not a guess, and according to Nielsen Norman Group, it uses hypothesis testing to establish that any difference you see is actually caused by the change.
What is A/B testing for beginners, in simple terms?
Think of it as a fair coin-flip experiment: half your visitors see the current version, half see a new idea, and you track one number to see which group did better. The key beginner mistake is checking results too early and stopping as soon as something looks promising, which the Stanford guide to controlled experiments flags as a major source of false positives.
What is A/B testing in medical terms?
In clinical research, the equivalent is a randomized controlled trial, where participants are randomly assigned to a treatment or control group to measure a specific health outcome. The underlying logic mirrors digital A/B testing: random assignment to isolate cause and effect, though medical trials carry additional ethical review and regulatory requirements that marketing and product tests don’t.
How long should an A/B test run?
Long enough to hit the sample size you calculated before launch for your desired statistical power, commonly targeting 80 to 95%, and never cut short just because an early trend looks good. For tests sensitive to weekly cycles (like e-commerce), running at least one full week, and ideally a full business cycle, helps avoid skewed results from day-of-week effects.
Can siift run A/B tests for me?
No. Our New Business OS is built for structured idea validation, strategy mapping, and go-to-market planning, not as a raw A/B testing platform. We help founders decide what’s worth testing and build the strategy around it; you’ll still need a dedicated testing tool to run the experiment itself.
Sources
- A/B testing
- The Peeking Problem in A/B Testing: The Statistical Mistake That Inflates Your False-Positive Rate To 40%+