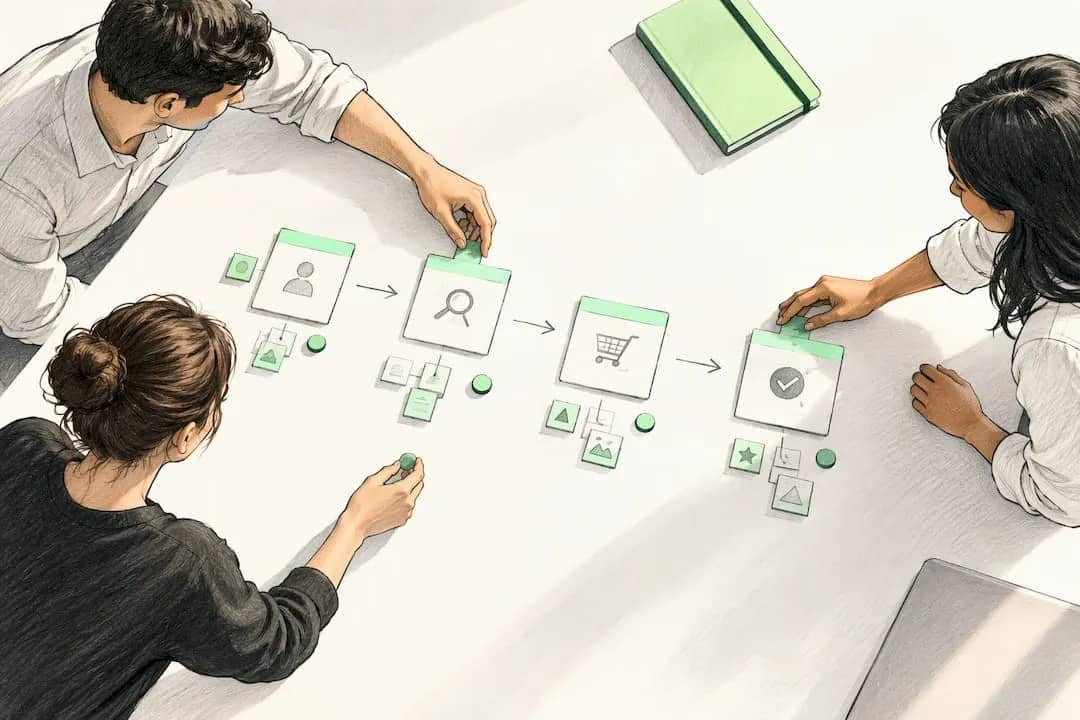

A customer journey is the full sequence of interactions someone has with your brand, from the first spark of awareness to the moment they become a loyal advocate. Mapping it matters because most revenue leaks happen in the gaps between departments, not inside them. If you want to start today, gather your product, marketing, and support leads, and sketch your best hypothesis of that journey before you research a single customer.
TL;DR:
- Mapping unowned moments, like social media searches or support gaps, reveals trust-buildings and risks often overlooked by internal team controls.
- Ending the customer journey on a high-value note consistently predicts greater satisfaction and willingness to pay than focusing only on initial engagement.
- Using a hypothesis-first approach with quick validation accelerates mapping and ensures the map reflects real customer behavior rather than assumptions.
- Prioritizing fixes at the journey’s end, such as renewal and offboarding, can generate more revenue impact than improving early-stage friction points.
- Cross-functional, living maps with assigned owners and clear metrics drive action and keep customer insights integrated into ongoing decision-making.
Table of Contents
- What counts as a customer journey (and what doesn’t)
- Customer journey stages, and how to pick the right model for you
- Why mapping the journey actually moves the needle
- How to build a customer journey map, step by step
- Choosing the right research method for your journey
- Which metrics to track at each stage
- Best practices, and the mistakes that waste a good map
- Templates and a quick-start workshop agenda
- Why personas shape the map more than most teams realize
- Getting departments to actually use the same map
- Keeping the map alive after the first workshop
- What pain points and opportunities look like once you map them
- How journey maps differ from service blueprints and experience maps
- Why hypothesis-first mapping beats “perfect data or nothing”
- Turn your journey map into an actual business strategy
- Sources
- FAQ
What counts as a customer journey (and what doesn’t)
Let’s clear up the vocabulary before we build anything, because sloppy terms lead to sloppy maps.
A customer journey is the entire arc of a person’s relationship with your brand, spanning every stage from discovery to advocacy. A buyer journey is narrower: it usually stops at the purchase decision, which makes it useful for sales teams but incomplete for anyone thinking about retention or lifetime value. A touchpoint is a single moment of contact, a support ticket, an ad click, an onboarding email, and a journey is made of dozens of these stitched together across time and channel.
There’s also a choice to make about how you frame the whole thing:
- Staged view: breaks the journey into discrete phases (awareness, consideration, decision, and so on), which is easier to assign ownership to.
- Continuous view: treats the journey as one uninterrupted relationship, which better reflects how subscription and community-driven businesses actually work.
- Actors to include: don’t map from your own perspective alone. Bring in the personas experiencing the journey, plus the internal stakeholders (sales, support, product) who touch it.
Most teams start with a staged view because it’s easier to socialize in a workshop, then evolve toward a continuous view once they’re tracking retention and expansion revenue. Neither is wrong. What’s wrong is mapping only the parts your team controls and ignoring the messy in-between moments, like when a customer searches your name on social media because your email support went quiet. Those unowned moments are often where trust is won or lost, and a map that skips them isn’t a map of the customer’s experience. It’s a map of your org chart.
Get the terms straight now, and every workshop, KPI conversation, and stakeholder debate later gets faster.
Customer journey stages, and how to pick the right model for you
Most frameworks converge on a similar backbone, even if the labels shift slightly by industry:
- Awareness: the customer realizes a problem exists or discovers your brand.
- Consideration: they compare options, read reviews, and weigh trade-offs.
- Decision: they choose (or don’t), often after a final trigger like a discount or a peer recommendation.
- Onboarding/Activation: they experience your product for the first time and either “get it” or don’t.
- Engagement/Retention: they use the product regularly and (hopefully) get value from it repeatedly.
- Advocacy: they refer others, leave reviews, or renew without hesitation.
That six-stage sequence works as a default, but don’t treat it as gospel. A complex B2B sale with a nine-month cycle and five stakeholders might need to split “Consideration” into “Problem Validation” and “Vendor Evaluation” because those involve completely different content and different buyers. A low-cost consumer app, on the other hand, might merge “Decision” and “Onboarding” into one stage because the gap between “sign up” and “first use” is measured in seconds, not weeks.
The rule of thumb: split a stage when the customer’s mindset or the metrics you’d track meaningfully change within it. Merge stages when they blur together in practice and tracking them separately just adds overhead without adding insight. Salesforce’s customer journey guidance lays out canonical stage frameworks that are a solid starting point, but the real work is adapting them to your sales cycle length and product complexity rather than copying a template wholesale.
One more thing worth saying out loud: your stage model doesn’t need to match a competitor’s or a textbook’s. It needs to match how your customers actually move, hesitate, and circle back. If your data shows people bouncing between “Consideration” and “Awareness” three times before buying, that’s not a flaw in your map. That’s the journey telling you something.
Why mapping the journey actually moves the needle
Journey mapping isn’t a design exercise you file away after a workshop. Done right, it changes where you invest, what you fix first, and how confidently you can defend a budget request. Teams that map journeys tend to catch friction earlier (before it shows up as churn), align departments around a shared view of the customer instead of five competing ones, and prioritize fixes by actual impact rather than internal politics.
Research backs this up in a specific and useful way.
A journey’s ending predicts satisfaction more than its middle does. Research from Harvard Business School finds that end value, meaning how the journey feels as it wraps up, is the strongest predictor of overall satisfaction and willingness to pay, with satisfaction and willingness to pay correlating at r = .42. That finding cuts against a popular assumption that dramatic highs and lows keep customers engaged. The evidence says otherwise: consistency and a strong finish beat a rollercoaster.
That single insight should reshape how you prioritize fixes. If your onboarding is rocky but your renewal conversation is excellent, you may be leaving more value on the table by improving the ending further than by smoothing the rocky start, though both matter. When you bring this to stakeholders, frame ROI in their language: reduced support costs from fewer repeat tickets, higher renewal rates from stronger end-of-journey moments, and shorter sales cycles when consideration-stage friction disappears. Executives fund maps that promise measurable movement, not maps that promise pretty diagrams.
How to build a customer journey map, step by step
You’ve got two honest paths here: hypothesis-first, which gets you a usable map in an afternoon, or research-first, which takes longer but starts with fewer assumptions. Most teams should do both, in that order.
- Define scope and objective. Pick one persona and one goal (reduce onboarding drop-off, increase renewal rate) rather than trying to map “the whole customer relationship” in one pass.
- Assemble a cross-functional team. Include product, marketing, sales, and support, and assign a facilitator, a notetaker, and someone who owns follow-up actions.
- Choose your persona and stage model. Use the stage framework from the previous section as a starting point and adjust for your sales cycle.
- Inventory touchpoints. List every channel and moment of contact you can think of: ads, emails, in-app messages, support tickets, sales calls, renewal reminders.
- Run the hypothesis workshop. In 90 minutes, have the team sketch what they believe happens at each stage: customer actions, mindset, emotion, and friction points. NN/g’s research on journey-mapping practice finds that a hypothesis-first approach is common among practitioners precisely because it forces alignment fast, even before a single customer is interviewed.
- Conduct research to validate. Interview customers, run diary studies for longer or cross-channel journeys, and pull analytics to see how often each friction point actually occurs. This is where you separate what your team assumes from what’s true.
- Synthesize findings into the map. For each stage, document the customer’s actions, mindset, emotional state, the evidence behind each claim, an owner, and a proposed opportunity.
- Validate with customers again. Show a draft map to a handful of real customers and ask if it matches their experience. Adjust based on what doesn’t ring true.
- Convert map items into experiments. Every friction point becomes a hypothesis with an owner, a success metric, and a deadline, not just a sticky note that dies on a wall.
Pro Tip: Run the hypothesis workshop before you book a single customer interview. It’s faster to correct a wrong guess than to build research from a blank page.
That last step is the one most teams skip, and it’s the one that matters most. A map that lives in a slide deck is a nice artifact. A map where every opportunity has a name attached and a date on the calendar is how you actually move satisfaction and revenue. If you’re building go-to-market plans off these insights, tools built for go-to-market planning can help translate mapped opportunities into a structured sequence of experiments rather than a loose list of good intentions.
One caution on the research-first path: don’t let the need for data become an excuse to delay. Perfect research on a stale map helps nobody.
Choosing the right research method for your journey
Different research methods answer different questions, and picking the wrong one wastes both time and trust with the customers you’re studying.
- Interviews are the workhorse of journey research. They’re fast to set up and great at surfacing the “why” behind a behavior, and NN/g’s practitioner research finds interviews are the most widely used method for building journey maps.
- Diary studies ask customers to log their experience over days or weeks, which makes them the better choice for long or cross-channel journeys where memory alone would miss details. NN/g’s research also finds diary studies are comparatively underused, despite being uniquely suited to capturing journeys that unfold slowly.
- Field studies (watching customers in their actual context) reveal friction that people don’t think to mention in an interview because it’s become normal to them.
- Analytics don’t tell you why something happens, but they tell you how often, which is essential for prioritizing which friction point to fix first.
The practical mix looks like this: use interviews to generate hypotheses and hear the story behind a behavior, use diary studies when the journey spans weeks or multiple channels and you need to track it as it happens, and use analytics to quantify how widespread an issue is before you commit engineering time to fixing it. NN/g’s guidance on conducting journey research recommends exactly this kind of triangulation, pairing qualitative depth with quantitative scale rather than relying on either alone.
Sampling matters more than people expect. A handful of interviews with your loudest customers will skew your map toward outliers. Aim for a mix of recent converts, long-tenured customers, and a few who churned or almost did. Timing matters too: research conducted right after a customer signs up captures a different emotional state than research conducted three months in, so be explicit about which moment in the relationship you’re studying.
If you’re early-stage and don’t have much of a customer base yet, the research muscle you build here doubles as customer discovery work that feeds your broader validation process, not just your map.
Which metrics to track at each stage
A map without metrics is a nice story. A map with metrics is a decision-making tool. Here’s how stages typically connect to measurable signals, based on the KPI patterns industry guidance from Salesforce recommends for journey analytics.
| Stage | Primary KPI | Behavioral signal to instrument |
|---|---|---|
| Awareness | Traffic and reach | First-touch source, ad impressions |
| Consideration | Engagement rate | Content views, comparison page visits |
| Decision | Conversion rate | Cart abandonment, demo requests |
| Onboarding/Activation | Activation rate | Time to first value, setup completion |
| Engagement/Retention | Churn rate | Feature usage frequency, support ticket volume |
| Advocacy | NPS and referral rate | Review submissions, referral link shares |
The instinct to track everything at every stage is understandable and wrong. Pick one or two KPIs per stage that actually predict the outcome you care about, then instrument the specific events behind them, like time-to-first-value for activation or ticket volume as an early churn signal. When a KPI dips, pair it with the qualitative evidence from your interviews or diary studies to understand why, not just that it happened. A conversion rate drop paired with interview feedback about confusing pricing tells you exactly where to focus, while the number alone just tells you something’s wrong. For a deeper look at building this measurement layer, our guide to measuring customer engagement walks through instrumentation in more detail.
Best practices, and the mistakes that waste a good map
The biggest mistake in journey mapping is building the journey you wish you had instead of the one customers actually experience. Aspirational maps look great in a boardroom and fall apart the moment you interview a real customer.
- Map real behavior, not the ideal flow. If customers regularly skip a step your team assumes is mandatory, the map should show that.
- Keep the map focused. A map trying to cover every persona and every product line becomes too broad to act on.
- Assign ownership. Every stage and every opportunity needs a named owner, or the map becomes a poster nobody updates.
- Treat it as a living document. Revisit the map on a schedule, not just when something breaks.
- Watch for facilitator bias. A workshop dominated by the loudest voice in the room produces a map that reflects internal opinion, not customer reality.
Pro Tip: If your journey map has no bad moments in it, you didn’t research it. You imagined it.
The teams that get real value from mapping treat it less like a one-time deliverable and more like a shared reference document that shapes weekly prioritization conversations.
Templates and a quick-start workshop agenda
You don’t need fancy software to start. A spreadsheet with seven columns does the job: stage, customer action, channel, emotion, evidence, owner, opportunity. Fill in what you know, mark what’s a guess, and let research fill the rest.
Here’s a mini example for a SaaS activation stage:
- Stage: Onboarding.
- Action: Customer connects their first data source.
- Emotion: Anxious, unsure if setup is correct.
- Evidence: Support tickets referencing “connection failed” spike in week one.
- Opportunity: Add a real-time connection test with clear success confirmation.
For running your own session, two agendas work well:
- 90-minute version: 15 minutes framing the goal, 45 minutes mapping stages as a group, 20 minutes identifying top three opportunities, 10 minutes assigning owners.
- Half-day version: adds time for reviewing existing analytics, a short round of customer quotes or clips, and a prioritization exercise using impact versus effort.
Either agenda gets you a usable draft. The step-by-step approach to customer development pairs well here if you want a structured way to turn workshop guesses into validated interview questions afterward.
Why personas shape the map more than most teams realize
A journey map without a persona attached is really a map of an average customer who doesn’t exist. Personas give the map a point of view: a specific person with specific motivations, constraints, and prior experience, which is what makes the emotional and behavioral detail in a map ring true instead of generic.
Different personas often experience the same product through entirely different journeys. A solo founder evaluating your tool cares about speed to value and price. An enterprise buyer on the same product cares about security review and stakeholder buy-in, and their “Consideration” stage might last months longer and involve people who never touch the product itself. Map both under one generic journey and you’ll produce advice that fits neither well.
This is also where a lot of teams overcomplicate things. You don’t need a dozen detailed personas to start. Pick the one or two that represent your most valuable or highest-volume customer segments, and build separate journey maps for each if their paths genuinely diverge. If they converge after the awareness stage, you can merge the maps there and split only where the experience actually differs.
Personas built from real interview data, not internal assumptions about “who our customer is,” are what keep a journey map honest. When the persona is fictional, the emotions and friction points you assign to it tend to be fictional too.
Getting departments to actually use the same map
A journey map that lives only in the marketing team’s folder isn’t aligning anyone. The value of mapping comes from giving every department, sales, support, product, a shared reference point for decisions they were already going to make separately.
Start alignment during the workshop itself, not after. When product, marketing, and support map the journey together, disagreements about what actually happens at a given stage surface immediately, which is far more useful than discovering the disconnect three months later when a launch underperforms. NN/g’s research on practitioner methods finds that most teams that build maps collaboratively involve exactly this mix of functions, and that cross-functional involvement is part of what makes the resulting map durable.
After the workshop, give the map a home everyone can access and reference in their own planning: a shared doc, a wiki page, whatever your team actually opens. Tie specific KPIs from the map to the team that owns them, so a support team sees their metric next to the stage they influence, and a marketing team sees theirs next to the top of the funnel. Revisit the map at a standing meeting, even quarterly, so it stays part of the conversation rather than becoming a one-time artifact everyone forgets by the next planning cycle.
Keeping the map alive after the first workshop
A journey map’s shelf life is short if nobody updates it. Customer behavior shifts as your product changes, as competitors move, and as the market itself evolves, so a map built a year ago is describing a customer who may no longer exist.
Set a review cadence up front, quarterly works for most teams, and tie it to a trigger, not just a calendar date. A major product launch, a pricing change, or a noticeable shift in churn or NPS are all good reasons to pull the map back out ahead of schedule. Assign the review itself to the same owner who holds the map day to day, so updating it isn’t an orphaned task nobody remembers to pick up.
The most useful update technique is small and continuous rather than a full rebuild: pull a fresh batch of support tickets or interview notes each quarter and check whether the friction points on the map still match what customers are actually saying. If a pain point has disappeared from the data, retire it. If a new one keeps showing up, add it and assign it an owner before it becomes a bigger problem. This keeps the map close to reality without requiring the full workshop cycle every time.
What pain points and opportunities look like once you map them
The value of a journey map shows up the moment you see a friction point you didn’t know existed. A common pattern: support ticket volume spikes right after onboarding, and when you dig in, it turns out customers don’t understand a confirmation step that your team assumed was obvious. That’s not a training problem. That’s a design problem the map just surfaced.
Another common find: customers who convert quickly during a free trial but churn within the first month often reveal, through interviews, that they never reached the feature that would have proven the product’s value. The map shows this as a gap between “activation” and “engagement,” where the customer technically signed up but never had the “aha” moment that would keep them around.
Opportunities surface just as clearly. If diary study data shows customers repeatedly checking a competitor’s pricing page during the consideration stage, that’s a signal to test clearer, more upfront pricing rather than assuming your sales team can close the gap in a call. If analytics show a specific onboarding step has a steep drop-off, that step becomes the first experiment on your list, not the tenth. Mapping doesn’t just describe problems: done well, it ranks them, so the fix with the highest impact and the fix with the loudest internal advocate aren’t accidentally treated the same.
How journey maps differ from service blueprints and experience maps
These three terms get used interchangeably, and that confusion costs teams time in the wrong meetings.
A customer journey map shows the experience from the customer’s point of view: their actions, emotions, and touchpoints across stages. It’s built for anyone trying to understand or improve what the customer feels and does.
A service blueprint takes the same journey and adds a second layer underneath it: the internal processes, systems, and staff actions that produce each customer-facing moment. If the journey map shows a customer getting a fast, accurate support response, the service blueprint shows the ticketing system, the staffing model, and the escalation process that make that possible. Blueprints are the tool of choice when the problem is operational, not just experiential.

An experience map is broader still. It looks at a general human experience, like “trying to get healthier,” without tying it to a specific product or brand. It’s useful for early-stage strategy and innovation work, before you’ve decided exactly how your product fits into that broader story.
The practical rule: start with a journey map when your question is about your specific customer’s specific path. Move to a service blueprint when you’ve found a friction point and need to know which internal process is actually causing it. Reach for an experience map only when you’re exploring a market or opportunity space broader than your current product.
Why hypothesis-first mapping beats “perfect data or nothing”
Here’s an opinion that might ruffle a few feathers: most journey mapping advice overweights research purity and underweights speed. Teams get stuck trying to build the “correct” map with a full research program before they act on anything, and by the time the research wraps up, the market, or the product, has already moved.
The teams that get real value from mapping treat the first draft as a hypothesis, not a finding. They sketch what they believe is true in a room with the people closest to the customer, then spend their limited research time validating or killing the riskiest assumptions, not documenting every assumption with equal rigor. That’s not a shortcut around good research. It’s a smarter sequencing of it, and it matches what practitioner surveys on journey mapping actually find: hypothesis-first is the common starting point, not an exception.

The other underappreciated point is about endings. Most teams pour resources into the flashy, top-of-funnel moments, the ad, the landing page, the demo, while the unglamorous final stretch of a journey (the renewal email, the offboarding flow, the last support ticket before a customer churns) gets almost no attention. The research on end value suggests that’s backward. If you can only fix one part of the journey this quarter, fix the ending before you fix the beginning.
Agentic AI tools are starting to compress the synthesis step that used to eat weeks of a researcher’s time, turning raw interview notes and analytics into a structured map faster than a team could manually cross-reference them, as explored in agent-first brands adapting for AI-driven discovery. That doesn’t replace judgment. It just means the gap between “we have a hunch” and “we have a validated map” keeps shrinking, which is good news for any team without a dedicated research function.
— Samim Safaei
Turn your journey map into an actual business strategy
Mapping the journey is only half the job. The harder part is turning what you learn into a prioritized plan instead of a backlog of good ideas nobody executes. That’s exactly the gap siift’s AI Business Strategy Platform is built to close: it takes the opportunities you surface in a mapping workshop and helps you sequence them into a validated strategy instead of a scattered list of “we should fix this someday” notes.
This is especially useful if you’re an early-stage founder or a small product team without a dedicated research or strategy function. The platform guides you step by step through turning customer insight into a go-to-market plan, filtering out the biases and blind spots that creep into any workshop dominated by internal opinion rather than customer evidence.
If you want to see how it fits your stage of building, check the siift pricing page for the Free, Discover, and Focus plans, or explore the business strategy platform directly to see how it turns mapped insight into a plan you can act on this week.
Sources
If you want to go deeper on any of the research referenced here, these are the primary sources worth reading in full:
- HBS: How patterns of customer experience shape satisfaction and choice (2023)
- NN/g: How to conduct research for customer journey mapping (2019)
- Salesforce: Customer journey guide (2025)
FAQ
What is the difference between a customer journey and a customer experience?
A customer journey is the sequence of steps and touchpoints a person moves through with your brand, while customer experience is the quality of how that journey feels at each point. You map the journey to understand the path, then measure experience to know whether that path felt good or frustrating.
How often should you update a customer journey map?
Most teams benefit from a quarterly review, paired with an immediate refresh after a major product launch, pricing change, or noticeable shift in churn. Treating the map as a living document tied to a recurring team meeting keeps it from going stale.
What is the best way to start mapping if you have no budget for research?
Run a 90-minute hypothesis-first workshop with a cross-functional team to sketch your best guess at the journey, then validate the riskiest assumptions with a handful of customer interviews. NN/g’s practitioner research finds this hypothesis-first approach is already the common starting point among teams building maps.
Do customer journey maps work for both B2B and B2C businesses?
Yes, though B2B journeys typically involve longer consideration stages and multiple stakeholders, which often means splitting the consideration stage into separate steps like problem validation and vendor evaluation. B2C journeys tend to move faster and can sometimes merge stages, like decision and onboarding, into a single step.
What should a customer journey map include at minimum?
At minimum, a map should show the stage, the customer’s action, their emotional state, the evidence behind each claim, an owner, and a proposed opportunity for improvement. Skipping the owner and opportunity columns is the most common reason maps end up ignored after the workshop that created them.