

Churn rate is the percentage of customers who stop doing business with you over a set period. The basic formula: (customers lost ÷ customers at the start of the period) × 100.
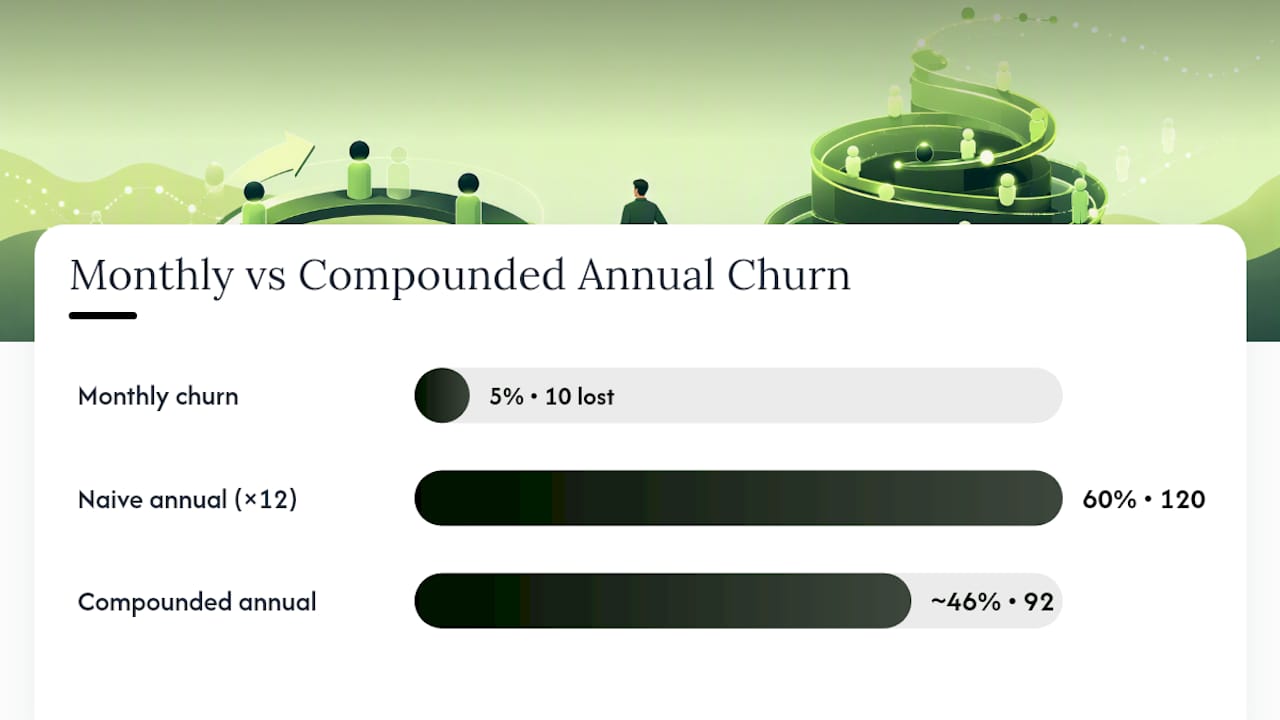
Say you start the month with 200 customers and lose 10.
- Customers lost ÷ starting customers × 100 = churn rate
- Track it monthly if you’re SaaS, quarterly if you’re long-contract B2B
- 5% monthly sounds small, but it compounds fast, more on that below
Key Takeaways
Churn rate measures the percentage of customers lost per period, and reducing it by even a few points meaningfully extends customer lifetime value and eases CAC payback pressure.
| Point | Details |
|---|---|
| Basic formula | Churn rate = (customers lost ÷ customers at start) × 100. |
| Watch the denominator | Start-of-period, average, or cohort-based counts each tell a different story. |
| Don’t multiply by 12 | Compounding means simple multiplication overstates annual churn. |
| Measure both churn types | Customer churn and revenue churn together reveal the full financial impact. |
| Act on it with structure | siift’s New Business OS helps turn churn diagnosis into prioritized growth experiments. |
Table of Contents
- Churn Rate Formulas and a Worked Example
- Should You Use Start-of-Period, Average, or Cohort Churn?
- Why Churn Quietly Wrecks Your Growth Math
- How to Measure Churn Without Fooling Yourself
- What Actually Reduces Churn (Ranked by Effort)
- Is Your Churn Rate Actually Bad?
- Mistakes That Quietly Corrupt Your Churn Number
- What Churn Really Tells You About Your Product
- Turn Your Churn Number Into an Actual Growth Plan
- Sources
- FAQ
Churn Rate Formulas and a Worked Example
There isn’t just one churn number. There are three you should know, and mixing them up is how founders end up making bad calls with good intentions.
- Customer (logo) churn: the percentage of accounts lost, regardless of size. Formula: (customers lost ÷ customers at start) × 100.
- Revenue churn (MRR churn): the percentage of recurring revenue lost, weighted by what each account actually pays. Formula: (MRR lost ÷ starting MRR) × 100.
- Net revenue churn: revenue churn minus expansion revenue (upsells, upgrades) from existing customers, giving you the real net effect.
Here’s the worked example. You start January with 200 customers paying an average of $100/month ($20,000 MRR). You lose 10 customers, all near the average price.
At 5% monthly, that’s 1 ÷ 0.05 = 20 months, per Investopedia’s breakdown of churn calculations. That’s a rough estimate, not a guarantee. It assumes churn stays flat, which it rarely does as a customer base matures. And don’t just multiply monthly churn by 12 to get an annual number. Compounding makes simple multiplication overstate the real annual figure, sometimes significantly.
Should You Use Start-of-Period, Average, or Cohort Churn?
The denominator you pick changes your number more than you’d expect, and picking the wrong one for your situation can mask real problems or manufacture fake ones.
- Start-of-period denominator: simplest, most common, and what Salesforce recommends as the default, excluding new customers who joined mid-period so growth doesn’t dilute your loss rate.
- Average customers during the period: smooths out volatility for businesses with lots of mid-month signups and cancellations, useful if you’re growing fast and start-of-period numbers feel misleadingly harsh.
- Cohort-based churn: groups customers by signup date and tracks how each group decays over time. This is the gold standard for diagnosis because it strips out the noise of blending brand-new users with five-year veterans, which churn analysis methodology treats as foundational, not optional.
- Revenue-weighted churn: switch to this when a handful of large accounts drive most of your revenue. Losing one $50,000 enterprise deal can hurt more than losing fifty $20 plans, and B2B churn analysis consistently flags this blind spot in customer-count-only reporting.
Why Churn Quietly Wrecks Your Growth Math
Churn doesn’t just cost you the customer you lost. It shrinks their entire remaining lifetime value, and that math compounds against you every single month.
Churn quietly taxes every growth target you set.
- Higher churn shortens customer lifetime value, which shrinks how much you can profitably spend to acquire someone
- It stretches your CAC payback period, since customers leave before you recoup acquisition costs
- It forces you to run faster on the acquisition treadmill just to hold your revenue line steady
As Harvard Business Review notes on customer value, keeping your right customers matters more than chasing every churn point equally. Not all lost customers cost you the same amount.
How to Measure Churn Without Fooling Yourself
Bad churn data gives you false confidence or false panic, neither of which helps you build anything. Get the inputs right first.
- Define “active” clearly. Is it billing status, product usage, or contract term? Pick one definition and stick with it, or your month-over-month comparisons become meaningless.
- Decide how reactivations count. A customer who cancels and returns within 30 days shouldn’t necessarily count as a fresh loss and a fresh win. Set a rule and apply it consistently.
- Pick your reporting cadence. Monthly works for SaaS with short sales cycles. Quarterly makes more sense for long-contract B2B, where monthly noise obscures the real trend.
- Run cohort analysis for diagnosis. Segment by signup month and watch decay curves. This is how you catch a bad onboarding flow before it tanks six months of new signups.
- Cross-check against billing and usage data together. A customer who stopped logging in but hasn’t canceled yet is a churn risk, not yet a churn statistic.
Pro Tip: Pull your churn data from billing records, not just product usage logs. Usage tells you who’s at risk; billing tells you who’s actually gone. Confusing the two is the fastest way to report a number that doesn’t match reality.
Our deeper guide on churn analysis walks through segmentation methods if you want to go further than the basics here.
What Actually Reduces Churn (Ranked by Effort)
Not every retention fix deserves equal attention. Some moves cost you an afternoon; others require a quarter of product work. Start cheap, start fast.
- Fix onboarding first. Most early churn traces back to customers who never reached their “aha moment.” An onboarding checklist A/B test, comparing a guided walkthrough against your current flow, is one of the highest-leverage experiments you can run in a week.
- Build a 30/60/90 touch cadence. Reach out at day 30, 60, and 90 with usage-specific nudges, not generic check-ins. This is cheap, scriptable, and catches disengagement before it becomes cancellation.
- Audit pricing and packaging. Sometimes churn isn’t a product problem, it’s a price-to-value mismatch. If customers downgrade before they cancel, that’s a signal worth chasing.
- Invest in customer success once you have volume. Proactive outreach to at-risk accounts, flagged by usage drop-off, is expensive to staff but effective at scale.
- Segment your interventions. Behavioral segmentation beats one-size-fits-all retention emails every time, because a power user going quiet needs a different message than a trial user who never activated.
Pro Tip: Run your first retention experiment on the smallest, cheapest lever, onboarding or the touch cadence, before touching pricing. You’ll learn faster and burn less goodwill.
Our proven retention tips for entrepreneurs has more copy-paste tactics if you want a running start. For readers running service businesses specifically, this partner guide on client retention covers tactics tailored to that model.
Is Your Churn Rate Actually Bad?
There’s no universal “good” churn number, and anyone who tells you otherwise is selling something. Benchmarks shift wildly by contract length, customer size, and industry.
- SMB-focused SaaS tends to run hotter on churn than enterprise software, simply because smaller customers have less switching friction
- B2B annual churn often lands around the low-20s percent as a rough industry reference point, though your mileage will vary by vertical
- Trial users and enterprise accounts should never be benchmarked against the same number, they behave nothing alike
The trendline matters more than any single snapshot. Benchmarks are noisy; your own month-over-month trajectory, segmented by account size, tells you far more than comparing yourself to an industry average pulled from a blog post.
Mistakes That Quietly Corrupt Your Churn Number
Most bad churn numbers aren’t lies, they’re math errors hiding in plain sight.
- Including new signups in the denominator inflates your apparent customer base and understates real churn.
- Double-counting reactivations as both a loss and a new win skews your trend without you noticing.
- Misclassifying dormant-but-not-canceled users as churned when they haven’t actually left yet, or the reverse.
- Multiplying monthly churn by 12 to get an annual figure. Compounding means the real annualized rate is lower than simple multiplication suggests, and reporting the wrong one can trigger panic decisions.
- Blending gross and net churn without labeling which one you’re showing. These are genuinely different metrics, and conflating them misleads your own team.
What Churn Really Tells You About Your Product
Churn isn’t just a metric to report upward, it’s a diagnostic. A high number early on usually means one of two things: your onboarding isn’t landing, or you’re selling to the wrong customer in the first place.

If your churn looks rough, fix onboarding first, then check whether you’re marketing to people who never needed what you built. Both are more common than a “bad product.” Run small experiments, measure weekly, and let the data argue with your assumptions before you overhaul anything expensive. The founders who win this aren’t the ones with zero churn, they’re the ones who diagnose fast and act faster.
Turn Your Churn Number Into an Actual Growth Plan
Calculating churn is the easy part. The harder part is connecting that number to your pricing, onboarding, and go-to-market decisions without juggling five spreadsheets and a dozen half-finished experiments. That’s where most founders stall out, not from lack of data, but from lack of a system to act on it.
siift’s New Business OS centralizes that work. Instead of manually stitching together churn math, retention experiments, and CLV projections, you get a structured way to turn a raw churn percentage into prioritized next moves, tied to your actual go-to-market strategy. Compare that to the DIY route of a spreadsheet plus a stack of retention blog posts: it works, but it’s slower, and nothing talks to anything else.
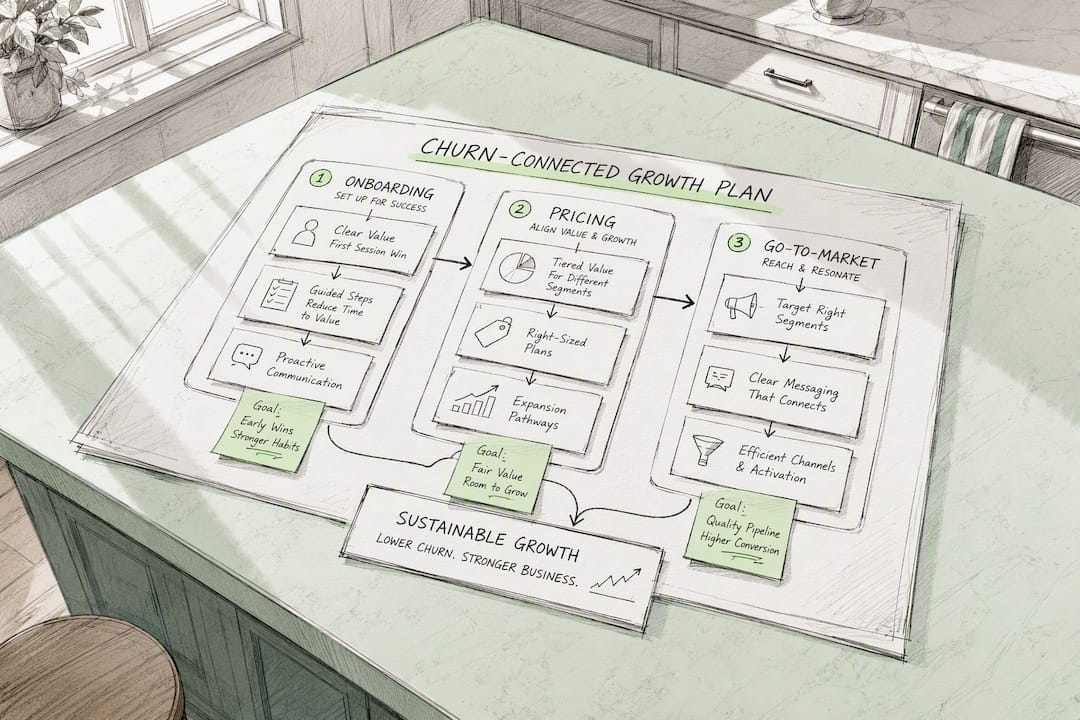
If you’re ready to connect your churn diagnosis to a real growth plan, start with siift’s go-to-market planning platform and see how the pieces fit together.
Sources
- What Is Customer Churn Rate? A Complete Guide (2026)
- What Is Churn Analysis: Complete Definition And Guide
- Customer Churn: Importance, How to Calculate, and Examples | Salesforce
- Churn Rate: Definitions, Examples, and Calculations | Investopedia
- Churn rate - Wikipedia
FAQ
How Do You Explain Churn Rate?
Churn rate is the percentage of customers who stop doing business with you during a given period, calculated as (customers lost ÷ customers at start) × 100.
What Does 5% Churn Mean?
How Do You Convert Monthly Churn to Annual Churn?
Don’t just multiply by 12, that overstates the real figure because losses compound over time; use a compounding calculation to get an accurate annualized rate.
What’s the Difference Between Customer Churn and Revenue Churn?
Customer churn counts lost accounts regardless of size, while revenue churn weighs losses by dollar value, which matters more in B2B where one large account can outweigh dozens of small ones.
Can siift Help Me Track and Reduce Churn?
siift’s New Business OS helps centralize your churn data and connects it to your broader go-to-market and retention strategy, so you can prioritize experiments instead of guessing.