
TL;DR:
- Real traction is measurable proof of market demand through consistent growth in key metrics.
- Founders should focus on retention, revenue, and engagement rather than vanity metrics like signups.
- Using targeted channels and AI tools accelerates building sustainable traction efficiently.
Most founders chase the wrong signals. They celebrate a viral tweet, a spike in app downloads, or a glowing press mention, and call it traction. But real traction is something far more grounding: it’s the measurable proof that the market actually wants what you’re building. Not guessed. Not hoped for. Measured. This guide breaks down what traction truly means, how to track it with the right metrics, and how to build it faster using practical strategies and AI tools. Whether you’re pre-revenue or scaling toward product-market fit, understanding traction is the clearest competitive edge you can give yourself.
Table of Contents
- What is traction? The real definition and why it matters
- How to measure traction: Key metrics and benchmarks
- Practical methods to build traction quickly (including AI tools)
- Common pitfalls, edge cases, and how traction really signals success
- Why focusing on actual distribution wins over just building products
- Accelerate your traction journey with the right tools
- Frequently asked questions
Key Takeaways
| Point | Details |
|---|---|
| Traction = real growth | Traction means measurable, consistent progress in metrics like revenue, users, and retention. |
| Metrics matter most | Focus on quantifiable metrics—revenue, active users, and retention—over vanity numbers. |
| Practical frameworks | Use systematic methods like the Bullseye Framework to prioritize and test growth channels efficiently. |
| Avoid vanity traps | Not all metrics indicate success; true traction shows customer value and product-market fit. |
| Leverage AI tools | AI accelerates traction testing, iterative experiments, and efficient growth for modern startups. |
What is traction? The real definition and why it matters
The word “traction” gets thrown around constantly in startup circles, often as a vague stand-in for “things are going well.” That ambiguity is dangerous. When you can’t define traction precisely, you can’t measure it, and when you can’t measure it, you’re flying blind.
So let’s be direct. Traction is quantifiable evidence of market demand and momentum, primarily measured as consistent growth in metrics like revenue, users, or engagement, proving product-market fit and customer value. That definition matters because it shifts the conversation from feelings to facts.
Founders need traction to make confident strategic decisions. Investors need it to justify writing a check. Your team needs it to stay motivated and aligned. It’s the shared language of progress.
“Traction is the best way to improve your chances of startup success. It is the measure of your product’s engagement with its market, a.k.a. product-market fit.” — Gabriel Weinberg and Justin Mares, Traction
Here’s where most early-stage founders go wrong. They confuse activity with momentum. Consider these common vanity metrics that feel like traction but aren’t:
- Raw signups without any follow-on engagement or retention
- Pageviews that don’t convert to meaningful actions
- Media mentions that generate curiosity but not customers
- Social followers who never interact with your product
- App downloads with no active usage after day one
None of these, on their own, prove that your business works. They’re noise. Real traction shows up in measuring early-stage traction through patterns: people returning, paying, referring others, and staying. That’s the signal worth chasing.
Why does this distinction matter so much right now? Because in 2026, the cost of building a product has dropped dramatically thanks to AI. More founders are shipping faster than ever. The new competitive advantage isn’t just building, it’s proving that what you built actually resonates. Your traction metrics guide should be the lens through which every product decision gets filtered. And understanding product-market fit is the north star that traction data helps you navigate toward.
How to measure traction: Key metrics and benchmarks
Understanding what “good” traction looks like is the next step. And good news: there are clear benchmarks that investors and experienced founders use to evaluate momentum.
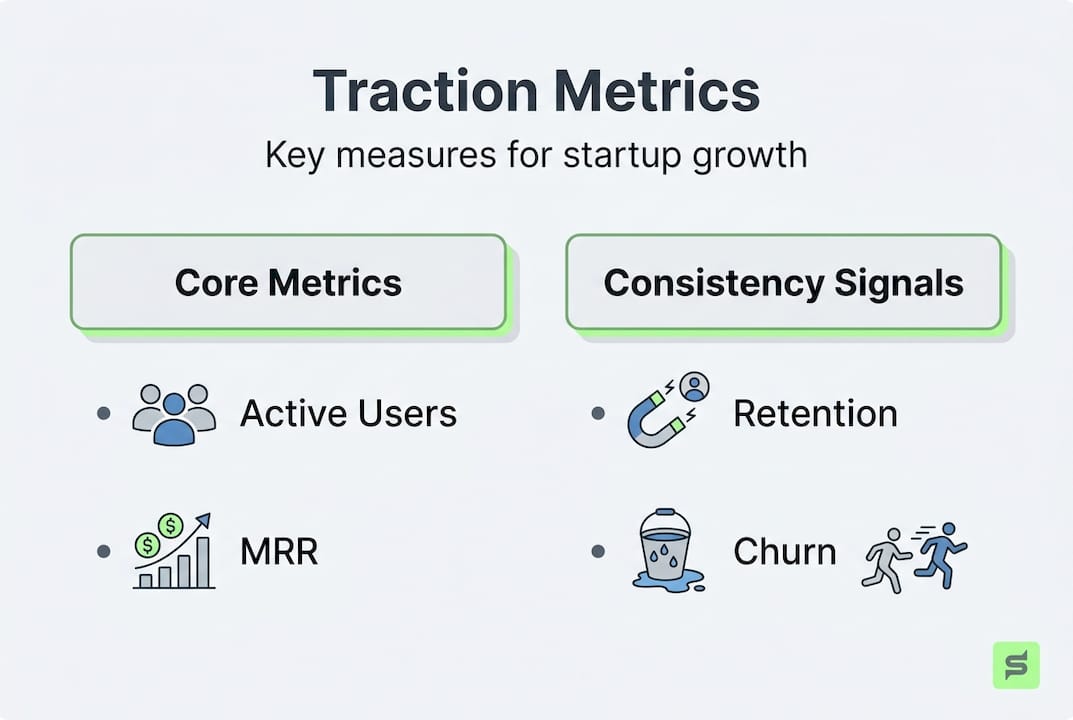
The most important traction metrics fall into these categories:
- Revenue: Monthly Recurring Revenue (MRR) or Annual Recurring Revenue (ARR). For B2B SaaS at the seed stage, $5k to $15k MRR is a common benchmark.
- Growth rate: Paul Graham’s growth benchmarks from Y Combinator suggest 5 to 7% weekly growth as a strong signal for early-stage startups. Month-over-month growth of 10 to 20% is healthy.
- Retention: 80% 30-day retention is a solid target. Monthly churn below 2% signals a sticky product.
- Engagement: A DAU/MAU ratio (daily active users divided by monthly active users) of 40% or higher indicates genuine habit formation.
- LTV:CAC ratio: Lifetime value to customer acquisition cost should be at least 3:1 for a sustainable business model.
- Active users: For B2C pre-seed startups, 10,000 to 50,000 monthly active users is a typical investor threshold.
Here’s a quick reference table to keep these benchmarks visible:
| Metric | Early-stage benchmark | Why it matters |
|---|---|---|
| MRR (B2B SaaS) | $5k to $15k | Proves revenue momentum |
| Monthly growth rate | 10 to 20% MoM | Shows compounding demand |
| 30-day retention | 80%+ | Signals product stickiness |
| Monthly churn | Under 2% | Indicates customer satisfaction |
| DAU/MAU ratio | 40%+ | Measures genuine engagement |
| LTV:CAC | 3:1 or higher | Validates unit economics |
| MAU (B2C pre-seed) | 10k to 50k | Demonstrates scale potential |
Consistency matters far more than spikes. A single viral moment that drives 10,000 signups in a week, followed by flat growth, tells a very different story than steady 15% month-over-month growth over six months. Investors know this. You should too.

Pro Tip: Choose one “North Star” metric that best captures the core value your product delivers, whether that’s MRR, active users, or weekly transactions. Track it obsessively. Review your top founder metrics and growth metrics for founders to find the right fit for your model. Understanding startup growth metrics at a deeper level will help you interpret what the numbers are really telling you.
Practical methods to build traction quickly (including AI tools)
After knowing what to measure, it’s time to build real momentum. The challenge most founders face isn’t awareness of channels, it’s knowing which channel to prioritize first.
This is where the Bullseye Framework becomes invaluable. Developed by Gabriel Weinberg and Justin Mares in their book Traction, the Bullseye Framework works like this: brainstorm all 19 possible traction channels (SEO, virality, sales, partnerships, content marketing, and more), rank them by potential, then run tight experiments on your top two or three. Double down on whatever works.
The most effective traction channels for early-stage startups in 2026 include:
- SEO and content marketing: Compounds over time and builds authority
- Referral programs: Customers who refer others have higher lifetime value
- Direct sales outreach: Especially powerful for B2B, where one conversation can close a deal
- Strategic partnerships: Piggyback on an existing audience that already trusts a complementary brand
- Paid advertising: Fast feedback loop for testing messaging, but requires positive unit economics
- Community building: Underrated and deeply sticky when done authentically
Now layer AI on top of this. AI-driven productivity strategies are reshaping how lean teams run growth experiments. AI tools can generate content at scale, personalize outreach sequences, analyze user behavior to surface retention risks, and automate lead qualification. What used to take a team of five can now be handled by a founder with the right stack.
Want to understand how to measure business productivity as you scale? That discipline becomes critical once AI amplifies your output, because more activity doesn’t always mean better results.
Pro Tip: Focus on one traction channel at a time. Spreading effort across five channels simultaneously gives you shallow data on all of them. Intensity on one channel gives you real signal. Once you find what’s working, explore your getting startup traction playbook and follow a step-by-step traction guide to systematize your approach. The startup traction growth guide can help you move from experimentation to execution.
Common pitfalls, edge cases, and how traction really signals success
Understanding traction doesn’t mean blindly chasing numbers. Here’s what to watch out for.
The most common mistake is treating signups, pageviews, or press coverage as proof of traction. They’re not. Vanity metrics without retention mislead founders into thinking they’ve found product-market fit when they haven’t. The result? Scaling a leaky bucket. You pour more money into acquisition while the back door stays wide open.
Watch for these warning signs:
- Spiky growth followed by plateau suggests a one-time event, not sustainable demand
- High signups, low activation means your onboarding or value proposition needs work
- Strong early engagement that fades points to a novelty effect, not a habit
- Flat growth across multiple channels is a signal to reassess product-market fit, not just marketing
Now for the edge cases. Pre-revenue startups aren’t without traction options. Pre-revenue traction signals include waitlists with strong conversion intent, paid pilots with enterprise customers, and signed letters of intent (LOIs). These are legitimate early indicators, especially in B2B, where the sales cycle is longer.
Here’s the contrarian view worth hearing:
“‘Traction’ is often a vague investor excuse for lacking belief in the team or the return path. What investors actually want is a clear path to market dominance, not just good short-term stats.” — Paul O’Brien
That’s a sharp perspective. Investors who say “come back when you have traction” often mean path to dominance over a 15 to 20x return, not just a good growth chart. Understanding this reframes how you present your business. It’s not just about numbers. It’s about narrative, defensibility, and momentum together. When you’re ready to pitch, knowing how to show traction to investors is as important as having the traction itself.
Why focusing on actual distribution wins over just building products
Having separated myth from reality, here’s the perspective very few founders hear early enough.
Most startups over-invest in product features. They add another integration, refine the UI one more time, or build the feature that three customers requested. Meanwhile, their competitors win on smarter distribution and quicker testing. As Weinberg and Mares put it, most startups fail on distribution, not on building.
“A product that reaches customers beats a perfect product that doesn’t.”
AI gives you a genuine leverage multiplier for distribution. But only if you’re measuring the right things. Founders who use AI to generate more content, more outreach, and more experiments without tracking retention and revenue are just failing faster. Speed without direction is expensive.
Consistent, compounding growth wins every time. Hype fades. The founders who build quietly, test relentlessly, and follow the quickest traction strategies with discipline are the ones who reach product-market fit. Distribution is not a marketing problem. It’s a founder mindset problem. Solve it early.
Accelerate your traction journey with the right tools
Ready to move from theory to practice? Here’s where technology can amplify your next steps.
Building real traction requires more than good intentions. It demands a system: one that helps you validate your idea, identify the right metrics, test channels efficiently, and iterate without burning out. That’s exactly what siift’s Intelligent Business Canvas is built for. As an Agentic AI platform designed specifically for founders and small business owners, siift guides you step by step through ideation, validation, and go-to-market strategy. It filters out the biases, blindspots, and distractions that slow most founders down. If you’re serious about accelerating your path to product-market fit, siift is the smartest place to start.
Frequently asked questions
What are the best metrics to use for measuring traction in a startup?
Key traction metrics include revenue (MRR/ARR), active users, growth rate, retention, churn, and engagement. The right mix depends on your business model, but retention and revenue are always the most telling.
Does getting lots of signups count as real traction?
No. Signups without retention are vanity metrics. Real traction requires recurring engagement, revenue, or both. Signups that don’t convert to active users tell you very little about actual demand.
How does traction differ for B2B vs B2C startups?
B2B startups track revenue milestones, paid pilots, or proof-of-concept agreements, while B2C focuses on user growth and engagement benchmarks like MAU and retention rates. Context always shapes what “good” looks like.
Can AI really help grow startup traction faster?
Yes. AI tools accelerate iteration across marketing, lead generation, content creation, and user behavior analysis, letting lean teams run more experiments in less time.
What should I do if my growth is flat despite trying multiple channels?
Reassess product-market fit first, then focus channel prioritization on one channel with intensity. Flat growth across multiple channels usually signals a product or positioning issue, not just a distribution problem.
Recommended
- What Is Business Traction? Essential Guide for New Founders 2026 | siift
- Master Early Business Traction Metrics Step-by-Step | siift
- Traction Metrics for Startups: Complete Guide | siift
- Show Investors Traction: A Step-by-Step Guide by Siift.ai in 2026
- Profitability optimisation: AI-driven strategies for SMBs
- What is paid search? A practical guide for business growth